
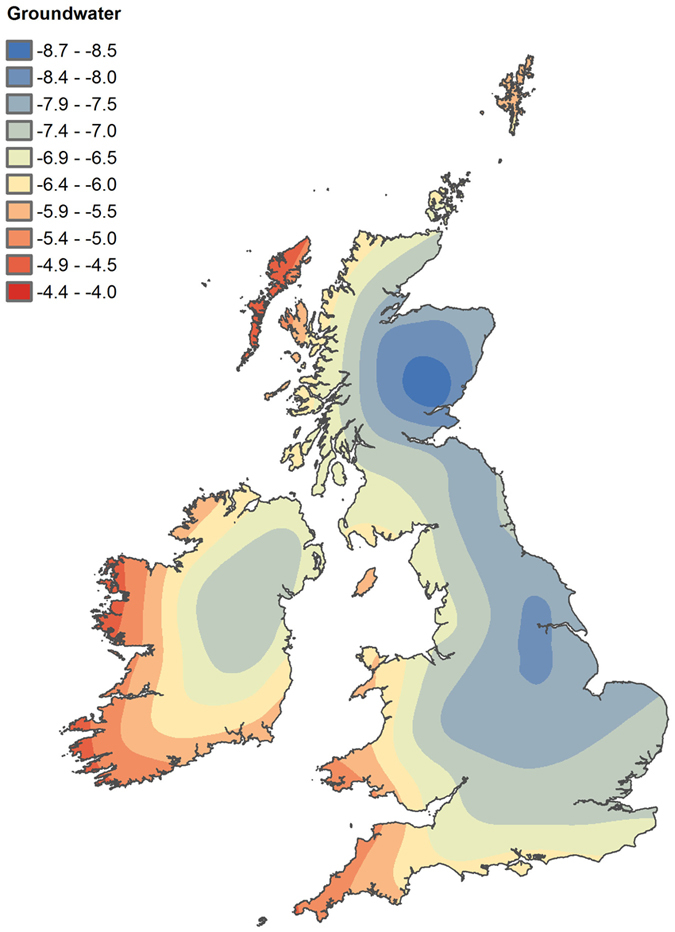
Figure 2. Groundwater oxygen isotope ratio distribution values from Britain and Ireland, showing the decrease in δ18O values from southwest to northeast (modified from Darling et al.26).
Official websites use .gov
A
.gov website belongs to an official
government organization in the United States.
Secure .gov websites use HTTPS
A lock (
) or https:// means you've safely
connected to the .gov website. Share sensitive
information only on official, secure websites.