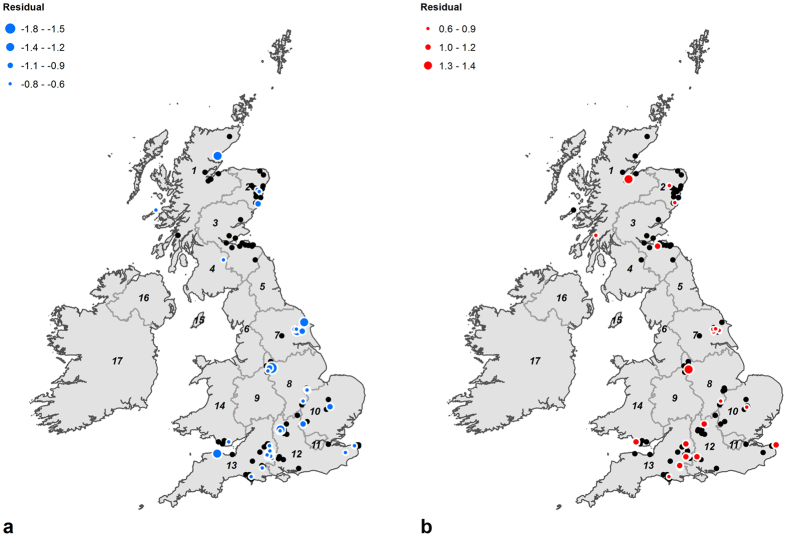
Figure 3. Plot of the positive (a-18O-enriched values) and negative (b-18O-depleted values) residuals from cross-validation of the geostatistical model, showing the inter-regional variability in δ18Op values incremented in steps of 0.3‰–the most reported measurement error in oxygen isotope analysis.
Positive and negative residuals are plotted separately to minimise the impact of overlapping symbols and highlight that samples with both 18O-enriched and 18O-depleted values occur in the same regions (Region codes: 1 Highlands and Islands, 2 North Eastern Scotland, 3 Eastern Scotland, 4 South Western Scotland, 5 North East, 6 North West, 7 Yorkshire and the Humber, 8 East Midlands, 9 West Midlands, 10 East of England, 11 London, 12 South East, 13 South West, 14 Wales, 15 Isle of Man, 16 Northern Ireland, 17 Republic of Ireland.). Cross-validation carried out using the Geostatistical Analyst extension for ArcGIS for Desktop 10.3.1 (http://desktop.arcgis.com/en/arcmap/10.3/guide-books/extensions/geostatistical-analyst/performing-cross-validation-and-validation.htm) © EuroGeographics for the administrative boundaries.

