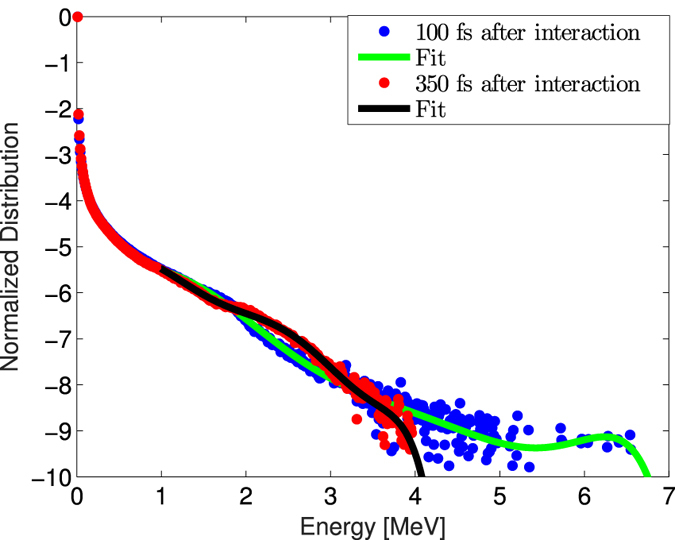
Figure 4. Energy spectrum of the emitted electrons.

The blue (red) points have been obtained 100 fs (350 fs) after the interaction with the laser. The solid lines represent the computed fit on such distributions. The y-axis is in logarithmic scale.

The blue (red) points have been obtained 100 fs (350 fs) after the interaction with the laser. The solid lines represent the computed fit on such distributions. The y-axis is in logarithmic scale.