
Figure 4. Energy spectrum of the emitted electrons.
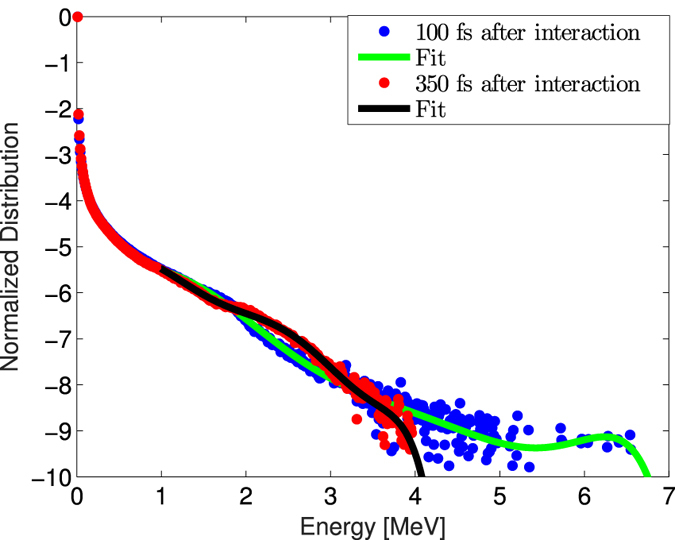
The blue (red) points have been obtained 100 fs (350 fs) after the interaction with the laser. The solid lines represent the computed fit on such distributions. The y-axis is in logarithmic scale.
Official websites use .gov
A
.gov website belongs to an official
government organization in the United States.
Secure .gov websites use HTTPS
A lock (
) or https:// means you've safely
connected to the .gov website. Share sensitive
information only on official, secure websites.
The blue (red) points have been obtained 100 fs (350 fs) after the interaction with the laser. The solid lines represent the computed fit on such distributions. The y-axis is in logarithmic scale.