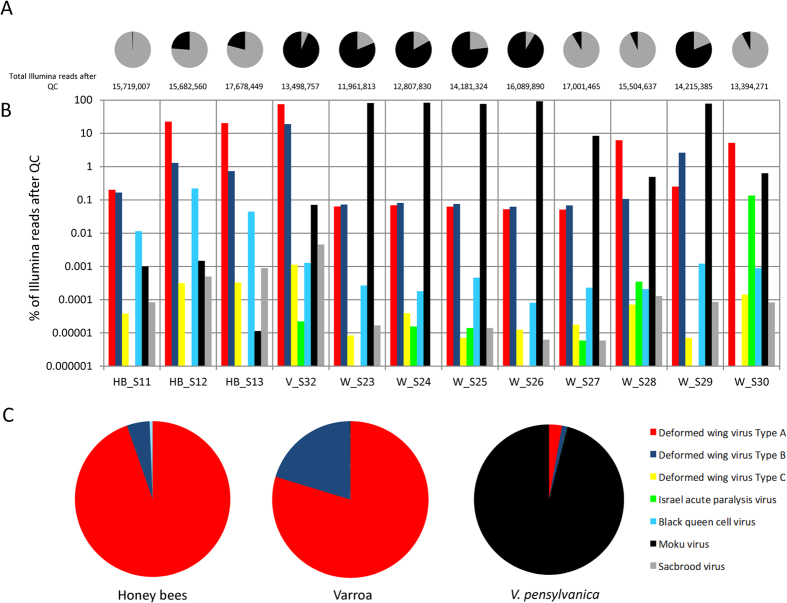
Figure 3.
(A) Proportion of total Illumina Hi-Seq reads which were attributed to viruses by BLAST labelled with the total number of Illumina reads after QC. (B) Illumina Hi-Seq Virome for each sample (W = V. pensylvanica, V = Varroa, HB = honey bee) showing the number of top BLAST hits against a custom virus database. Note a logarithmic scale has been used to display the vast differences between viruses. C) Pie charts showing samples grouped per species showing the proportion of viral hits determined by BLAST.

