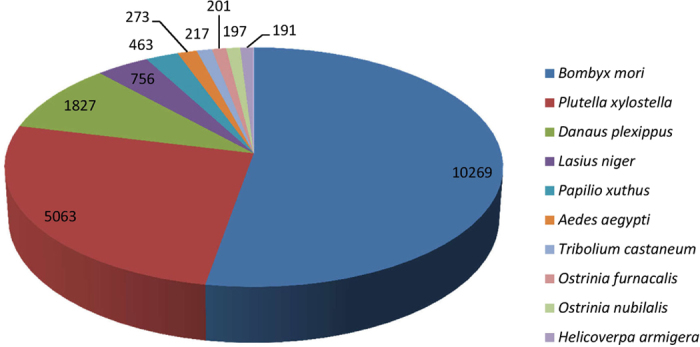
Figure 2. The top-ten species distribution of the BLASTX results.

Unigenes were aligned with the NCBI-Nr protein database with a cutoff E value < 10−5. Different colors represent different species.

Unigenes were aligned with the NCBI-Nr protein database with a cutoff E value < 10−5. Different colors represent different species.