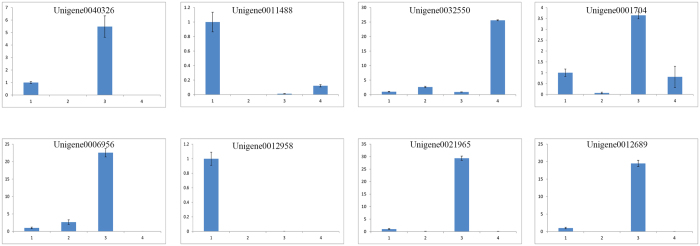
Figure 7. RT-qPCR analysis of eight randomly selected genes to confirm expression patterns indicated by sequencing.
Three technical replicates were performed for each of the three biological replicates. The height of each bar chart represents the mean average of sample-specific 2−ΔΔCt values. “1” represents the egg stage, “2” represents the larval stage, “3” represents the pupal stage, and “4” represents the adult stage.

