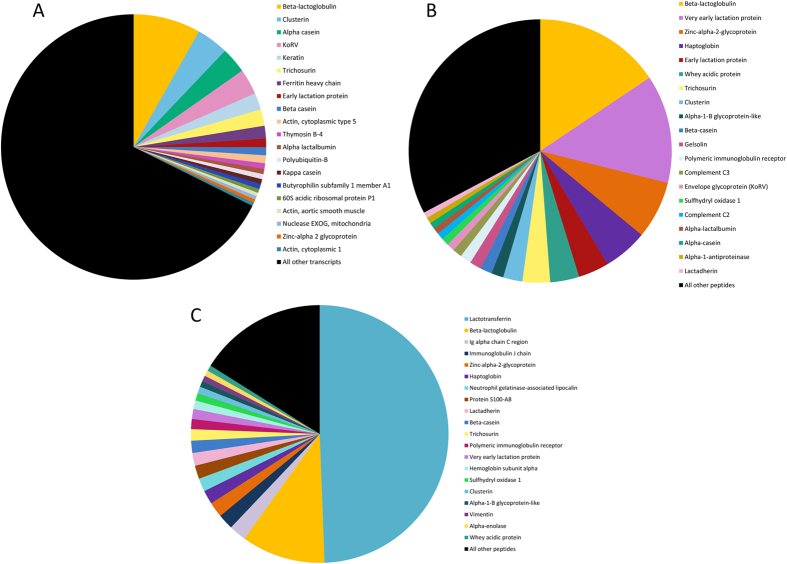
Figure 1. Pie charts of peptides/transcripts based on relative abundance as a percentage.
Top 20 in each koala data set is labelled, with remaining peptides/transcripts grouped under ‘All other’. (A) Early lactation mammary gland transcriptome. (B) Early lactation milk proteome. (C) Late lactation milk proteome.

