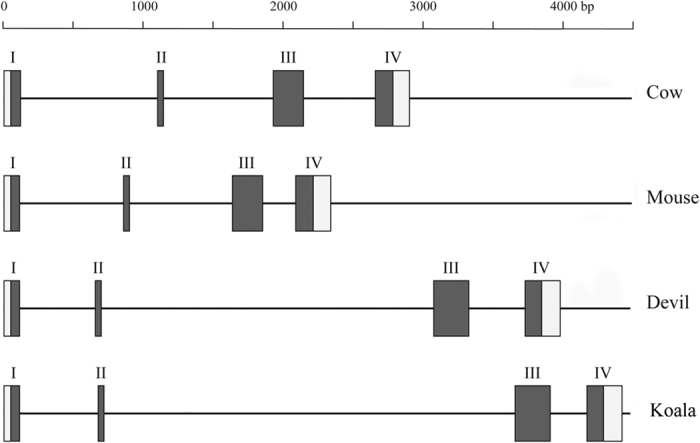
Figure 4. Schematic comparison of the gene structure of mouse (ENSMUSG0000002249) and cow (ENSBTAG00000013417) Glycam1 (PP3) and Tasmanian devil (GEDN01008364.1) and koala VELP.

Roman numerals indicate exon number. Filled in boxes indicate coding sequence, empty boxes indicate UTR sequences.
