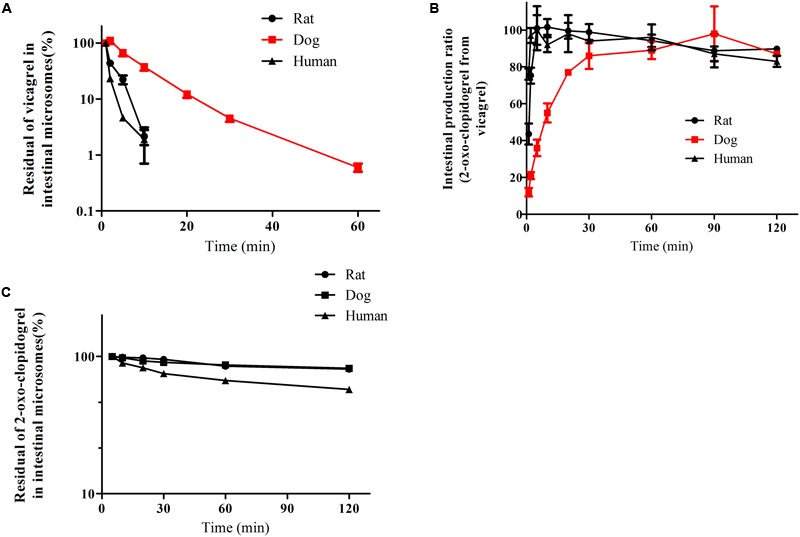
FIGURE 3.

The degradation profiles of vicagrel (A), 2-oxo-clopidogrel (B) and production profiles of 2-oxo-clopidogrel from vicagrel (C) in the intestinal microsomes from rat, dog and human (The reactions were conducted in pH 7.4 Tris buffer at 37°C and initiated by the addition of vicagrel with a final concentration at 10 μM; The line marked in red represented the profiles in dog).
