
Fig. 2.
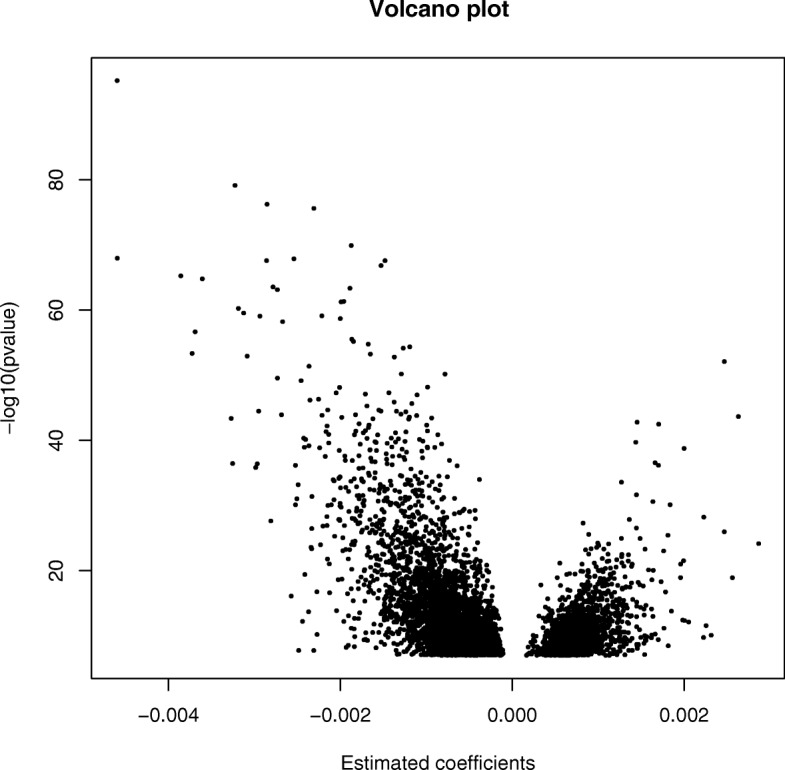
A volcano plot based on the 5474 significant CpG coefficient estimates (horizontal axis), resulting from the ultrasound estimated GA-based regression models, plotted against the corresponding p B values (vertical axis). Negative coefficient estimates indicate decreased methylation, while positive estimates designate increased methylation