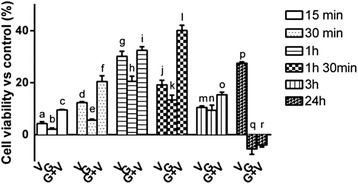
Fig. 3.

Time course of cell viability in GTL-16. The effects of vitD3 (V), Grisù® (G) and Grisù® combined with vitD3 (G + V) vs control (line 0 %) from 15 min to 24 h are reported. Data represent as a mean ± (SD) (%) of 6 biological replicates. a, b, c, d, e, f, g, j, k, l, m, n, o, p; p < 0.05 vs control; a, b p < 0.05 vs c; c, d, e p < 0.05 vs f; c, f, h p < 0.05 vs i; i, j, k, o, r p < 0.05 vs l; n p < 0.05 vs o; o, p p < 0.05 vs r
