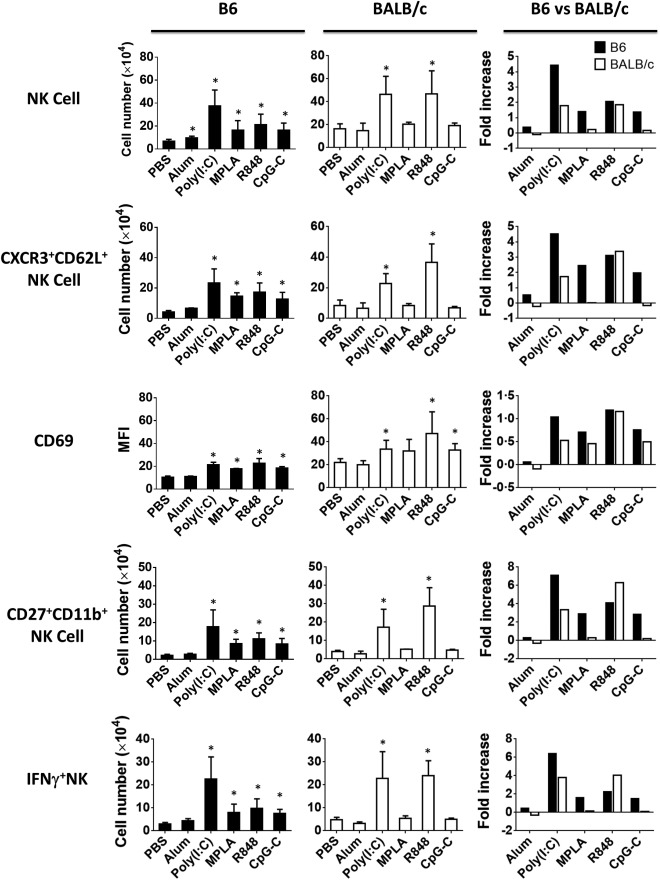
Figure 4.

Recruitment and activation status of natural killer (NK) cells in the lymph nodes of immunized mice. Mice were injected subcutaneously with ovalbumin (OVA) protein mixed with indicated Toll‐like receptor (TLR) agonists. Two days after immunization, single cell suspensions from the collected lymph nodes were analysed by flow cytometry. Bar graphs (left and mid panels) show the difference in the absolute number of CD3–CD49b+ NK, CXCR3+CD62+ NK, CD27+CD11b+ NK, interferon (IFN)‐γ‐producing CD27+ NK cells, their expression of activation marker CD69 and fold increase (right panels) over unimmunized mice in the lymph nodes of immunized B6 (filled black) versus BALB/c (open bars) mice. Data are expressed as mean ± standard deviation (s.d.); n = 2∼8 (n denotes number of individual animals).
