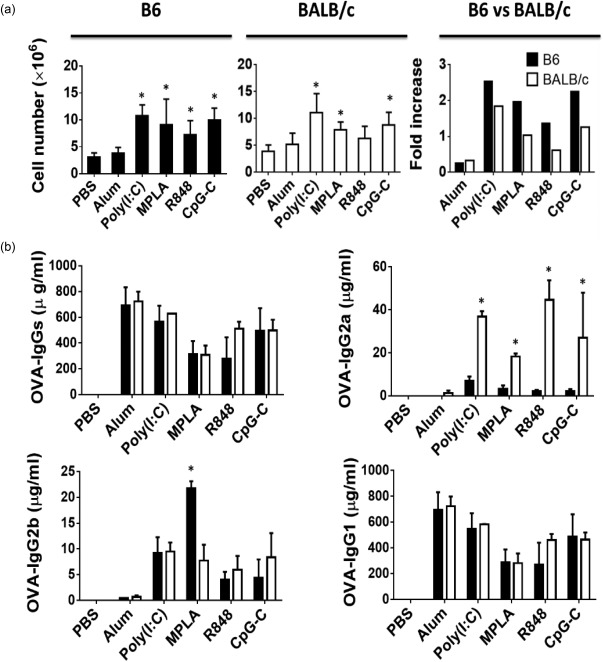
Figure 7.

Absolute number of B cells and production of anti‐ovalbumin (OVA) antibodies in immunized mice. (a) Bar graphs show the percentages of B cells 3 days after immunization (left and mid panels) and the fold increase (right panels) over phosphate‐buffered saline (PBS) immunization in B6 (filled black) and BALB/c (open bars) mice. (b) Bar graphs show the differences in the amounts of OVA‐specific immunoglobulin (Ig) subsets in sera between the two strains a week after the second immunization. Data are expressed as mean ± standard deviation (s.d.); n = 2∼8 (n denotes number of individual animals).
