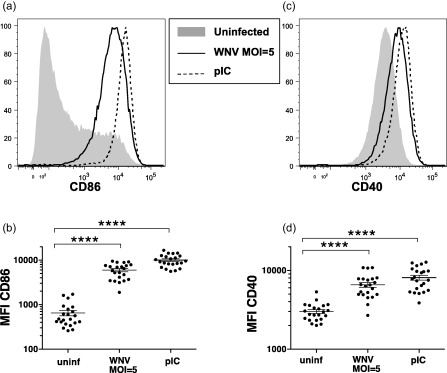
Figure 4.

West Nile virus (WNV)‐infected dendritic cells (DCs) increase expression of T cell co‐stimulatory molecules. DCs were left unstimulated, infected with WNV Kunjin isolate (WNVKUN) at multiplicity of infection (MOI) = 1 or MOI = 5 or stimulated with poly‐inosine‐cytosine (pIC), and cells were harvested after 48 h. (a,b) CD86 and (c,d) CD40 surface expression (MFI = mean fluorescence intensity) on DCs was determined using flow cytometry. Symbols represent individual donors. Significance was evaluated using a repeated‐measure (RM) one‐way analysis of variance (anova) followed by a Dunnett's multiple comparison test (comparing each stimulated value to the corresponding unstimulated value). **P < 0·01; ***P < 0·001; ****P < 0·0001.
