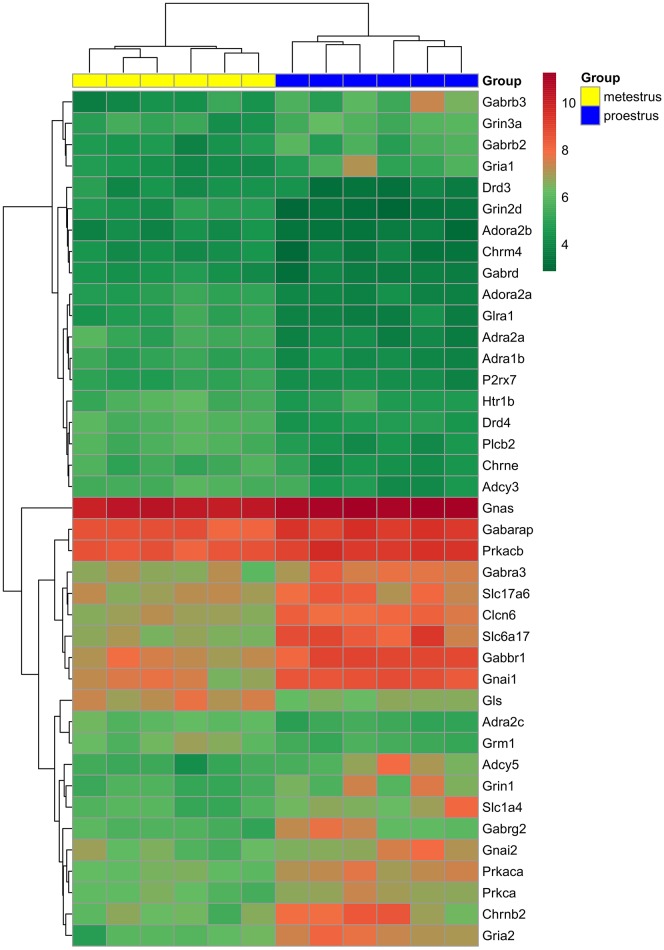
Figure 1.
Hierarchical clustering of genes and microarray experiments. Expression levels of the genes involved neurotransmitter signaling (see also Table 1) are visualized on a heat map. The rows represent differentially expressed probe sets with corresponding gene symbols on the right. The expression level of each probe is color coded: for decoding, see the color key. The individual samples are shown as columns. The six proestrous and metestrous samples are coded in blue and yellow, respectively.

