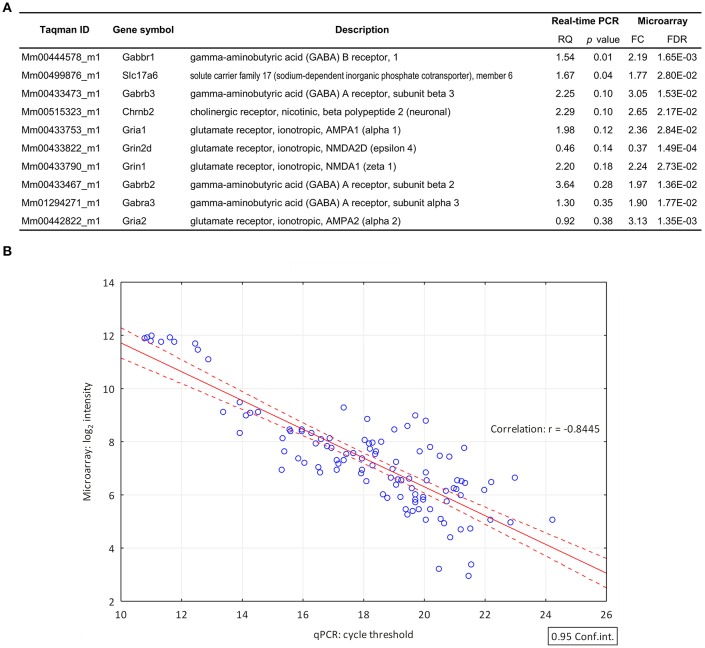
Figure 2.
Validation of differential gene expression data by quantitative real-time PCR. (A) List of genes (FC > 1.6; FDR < 0.05) selected for validation of their differential expression by qPCR. The qPCR confirmed the differential expression of 8 genes. RQ, relative quantity (B) The correlation coefficient (Pearson's r = −0.8445) indicates the quantitative correlation between the log2 transformed and normalized spot intensity values of microarray hybridizations and the cycle threshold (Ct) value of the qPCR investigations. X-axis, cycle threshold value; Y-axis, normalized microarray expression values.

