Figure 3.
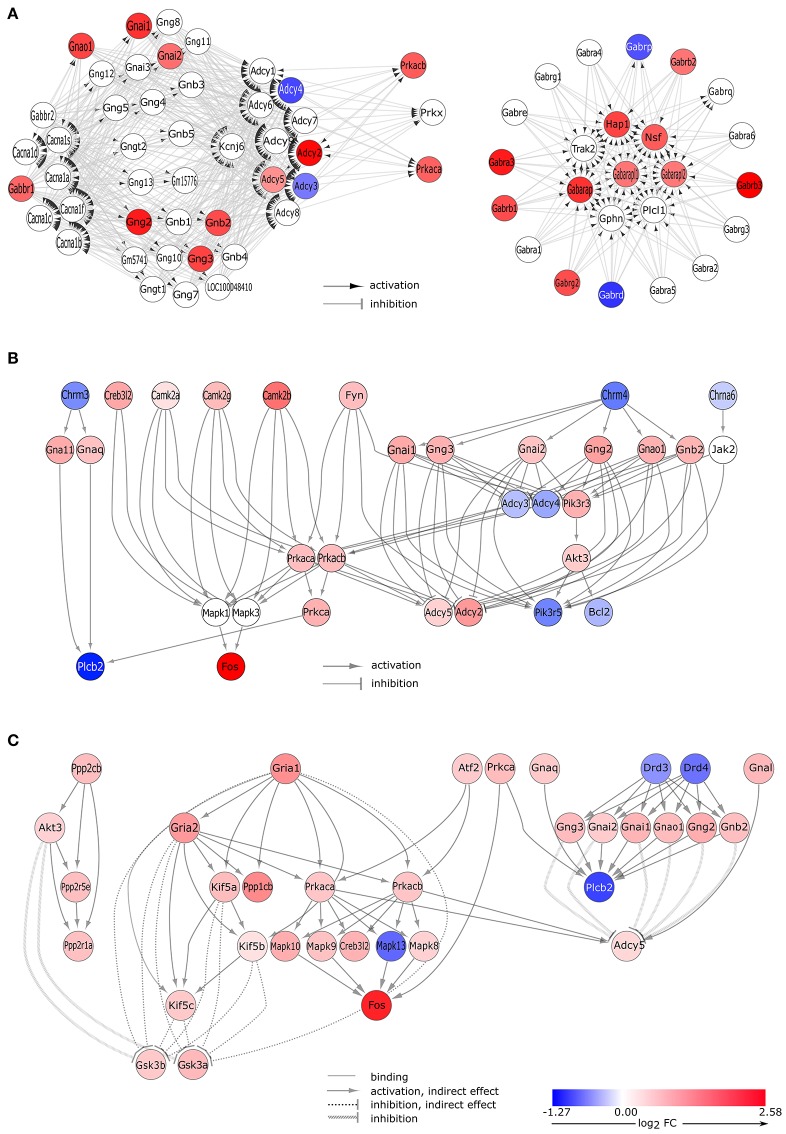
Gene expression changes in neurotransmitter signaling pathways. (A) GABA-ergic synapse pathway. Signaling Pathway Impact Analysis (SPIA) of the microarray data revealed significant enrichment of differentially expressed genes (DEGs) in the “GABAergic synapse” pathway (Bonferroni p = 0.005). Nodes and edges of the graph represent genes and their relations, respectively. Colored nodes indicate DEGs with color proportional to log2 fold change values. White node are genes that are not expressed differentially. (B) DEGs of the cholinergic synapse pathway. Gene expression data analysis by SPIA revealed differentially expressed genes that are involved in the “cholinergic signaling” pathway (Bonferroni p = 0.038). Interaction of differentially expressed genes are presented here. The complete pathway is shown in Supplementary Figure 4. (C) DEGs of the dopaminergic synapse pathway. Microarray data analysis by SPIA showed that a significant number of the differentially expressed genes was enriched in the dopaminergic signaling pathway (Bonferroni p = 0.035). Interaction of differentially expressed genes are presented here; the complete pathway is depicted in Supplementary Figure 5.

