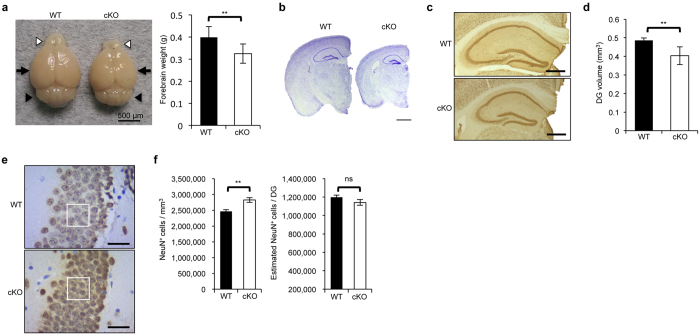
Figure 3. BCAS2 cKO mice show a microcephaly-like phenotype.
(a) Appearance of brains at 12 weeks of age. Left: gross view of brain. White arrowhead: olfactory bulb; black arrow: forebrain portion; black arrowhead: cerebellum. Right: forebrain weight (WT: n = 11; cKO: n = 16). (b) Nissl staining of coronal brain sections. Scale bar: 1 mm. (c) IHC with anti-NeuN antibody of representative series of every 12th 40-μm vibratome section. Scale bar: 500 μm. (d) DG volume measured by stereological analysis with ImageJ (n = 3). DG volume = (sum of the NeuN+ DG areas in every section) × 40 × 12. (e) IHC of NeuN+ cells. White box: 25 × 25 μm2 for counting the cell number, Scale bar: 25 μm. (f) Quantification of NeuN+ cell density (left) and estimated NeuN+ cell number (right) in the DG area. The cell density of granule cell layers in the DG was quantified from 50 randomly chosen counting frames for each genotype (the counting frame is indicated by the white box in panel e) and was then converted to the cell number per cubic millimeter (NeuN+ cells/frame area x section thickness, n = 3) multiplied by the DG volume. Quantitative results are shown as the mean ± S.D. and statistically analyzed by a two-tailed Student’s t-test.

