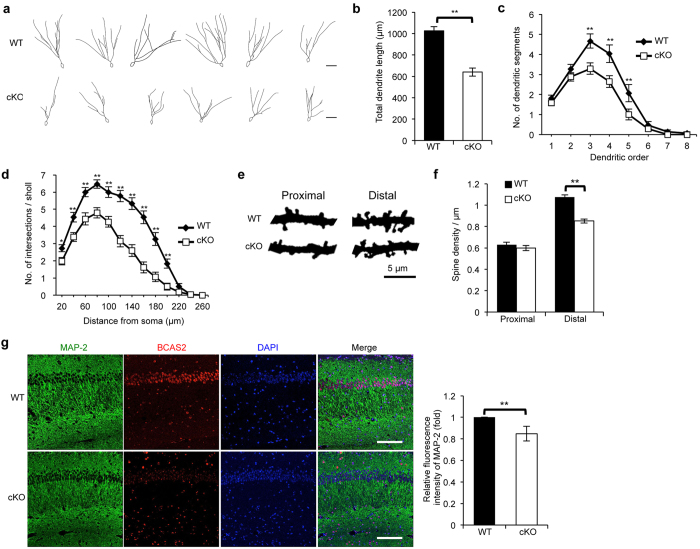
Figure 5. BCAS2 deletion causes reduced dendritic length.
Golgi-impregnated brains were collected and analyzed from mice of each genotype at 12 weeks of age. (a) Golgi staining of the DG region of the hippocampus. Six examples of Golgi-stained DG granule neurons were reconstructed according to the Golgi impregnation method. Scale bar: 50 μm. (b) The dendritic length was analyzed using granule cells of each genotype (WT, n = 31 cells; cKO, n = 42 cells). The total dendritic length of cKO mice was significantly reduced. The data were analyzed using a two-tailed Student’s t-test analysis and are shown as the mean ± S.E.M. (c) Complexity of the dendritic arbor evaluated by plotting the number of dendritic segments against the dendritic order. Results are shown as the mean ± S.E.M. The P value was analyzed by two-way ANOVA (WT, n = 31 cells; cKO, n = 34 cells). (d) The dendritic complexity of BCAS2 cKO mice was less than that of WT, as judged by Sholl analysis. The number of intersections between dendrites and concentric rings was plotted against the distance from the soma. Two-way ANOVA revealed a significant difference for the genotype effect and distance effect for both groups (WT, n = 31 cells; cKO, n = 34 cells). (e) Dendritic spines of the proximal (<50 μm from soma) and distal (>100 μm from soma) regions in Golgi-stained DG granule cells. (f) Quantification of panel e. Proximal region: WT, n = 52 segments from 31 cells; cKO, n = 64 segments from 34 cells. Distal region: WT, n = 63 segments from 31 cells; cKO, n = 86 segments from 34 cells. Results are shown as the mean ± S.E.M. and analyzed by a two-tailed Student’s t-test. (g) IFA of the MAP-2 antibody (dendritic marker). Scale bar: 100 μm. Right: quantitation of the left panel (n = 3). Panels b, c, d and f were measured for each group with at least 5 independent experiments.

