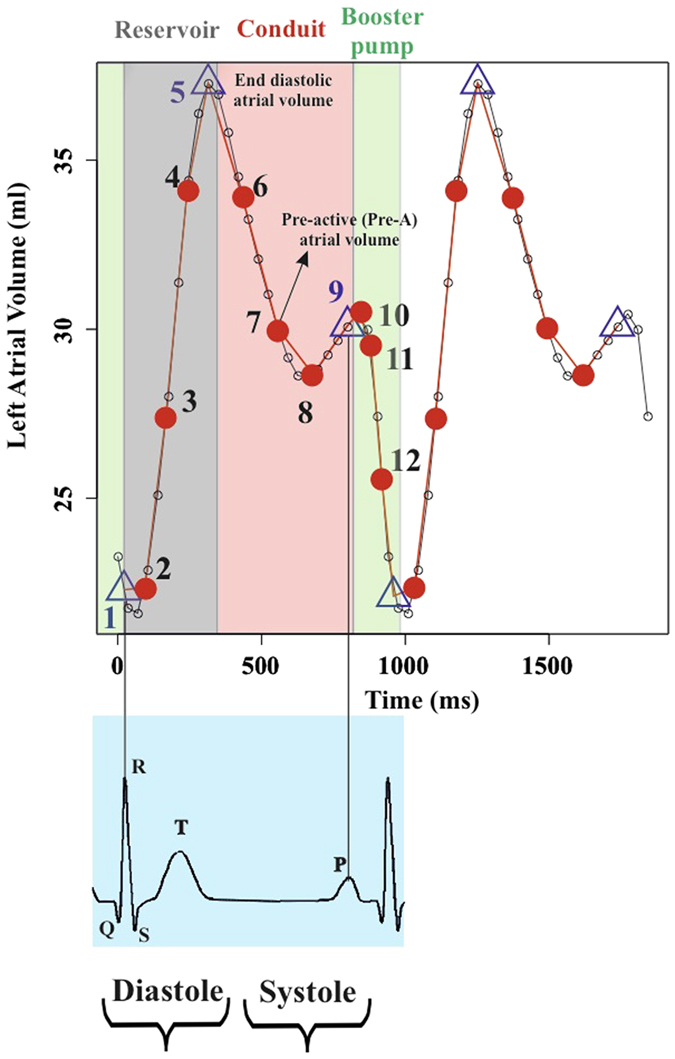
Figure 11. LA volume curve along 2 cardiac cycles.

Small dots identify the times at which 3DSTE acquisition is done (observed times). Among these, the 3 strictly homologous times are identified by a triangle, whereas the others homologous times by a red dot. All in all, a fine reconstruction of the actual LA trajectory is obtained.
