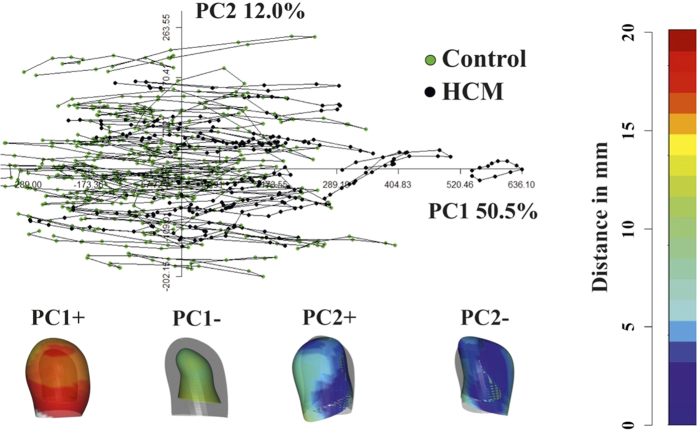
Figure 2. Classic GPA in SSS + PCA.
This figure clearly shows that PCA performed after GPA mixes intra- and inter- individual variation, thus impeding to appreciate pure deformations occurring within individuals. Deformations associated to PC axes extremes are shown. These are relative to the GM that is shown in light grey together with coloured shapes corresponding to axes extremes. The colormap ranges from blue (min) to red (max) and refers to |xM − x|, with xM the position of a point in the GM and x its position at the specified axis extreme (positive or negative).

