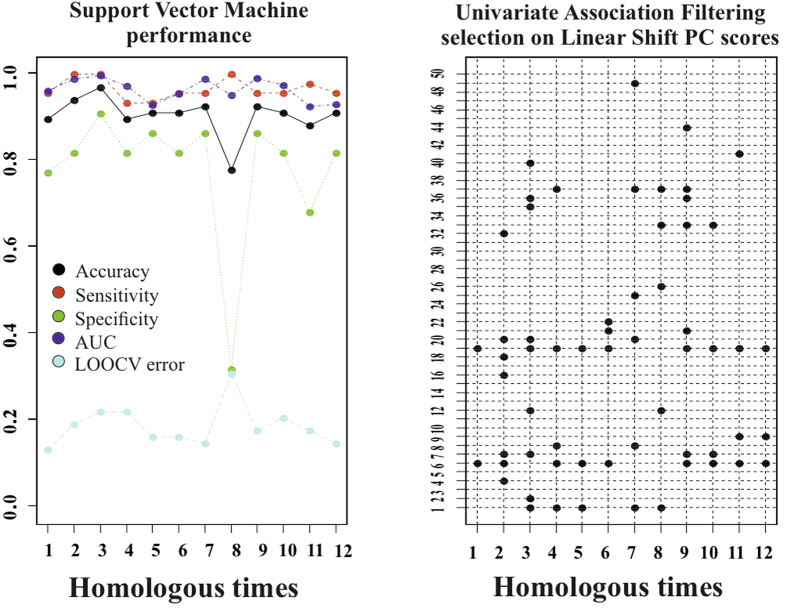
Figure 5. Classification performance of deformation analysis.
The first 50 PC scores coming from the deformation analysis were subjected to UAF (see text) and then to SVM. Left: the specified performance measures of SVM in classifying Controls or HCM are shown at any homologous times. Right: PC scores retained at each SVM run, being found significant in UAF, at any homologous time.

