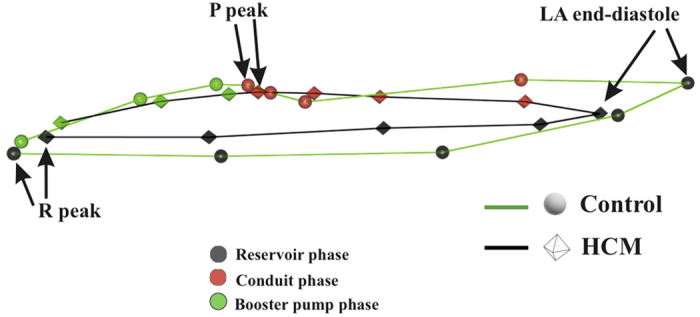
Figure 7. Actual mean trajectories shapes of Controls and HCM identified by the first 3 PC scores of LS analysis; it can be seen that both shape and size of the 2 trajectories are different.

Strictly homologous times are indicated.

Strictly homologous times are indicated.