
Fig. 1.
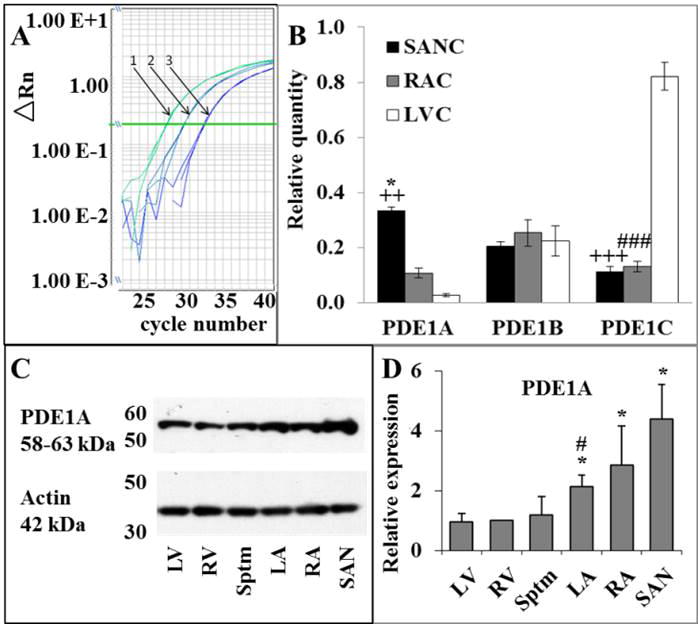
A, Example of amplification plot. 1 – SANC, 2 – RAC and 3 – LVC samples; B, expression profile of PDE1 subtype transcripts in SANC, RAC and LVC normalized to the expression of β-tubulin housekeeping gene, n = 6; * p < 0.05 for SANC versus RAC; ++ p < 0.01 for SANC versus LVC; +++ p < 0.001 for SANC versus LVC; ### p < 0.001 for RAC versus LVC; C, representative Western Blot of PDE1A immunolabeling of rabbit heart tissue lysates (left ventricle (LV), right ventricle (RV), Septum (Sptm), left atria (LA), right atria (RA), sinoatrial node (SAN)); D, averaged expression levels of PDE1A in rabbit heart tissues, normalized to the expression of actin, n = 3. * – differences between RA/SAN vs. ventricles/Sptm and LA, p < 0.05 ANOVA; *# – differences between LA and ventricles/Sptm, p < 0.05 ANOVA.