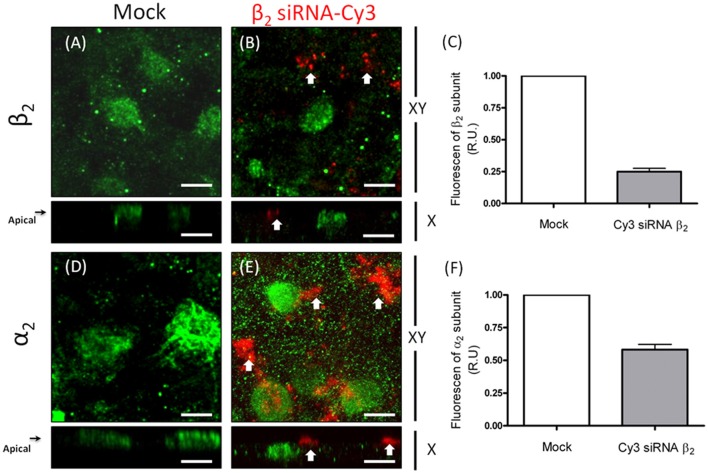
Figure 11.
Silencing of the β2 subunit in ARPE-19 cells affects the apical distribution of Na+, K+-ATPase. The transfected siRNAs for the β2 isoform are labeled with Cy3. Red fluorescent spots thus identify transfected cells. Confocal images of mock-transfected cells in which the β2 and α2 subunits are immunostained (A,D), respectively show an apical distribution pattern for both subunits. Images of silenced cells show an apical expression of the β2 (B) and α2 (E) subunits (green) in non-transfected cells. Arrows in (B) indicate the lack of β2 expression in the apical domain of siRNA-transfected cells. The absence of α2 immunostaining in the apical domain is also indicated by arrows in panel (E), implying the mislocalization of Na+, K+-ATPase from the apical domain. The fluorescence intensity of β2 (C) and α2 subunits (F) in silenced cells was measured in 10 different fields, and the mean ± SEM is shown. Scale bar: 10 μm.

