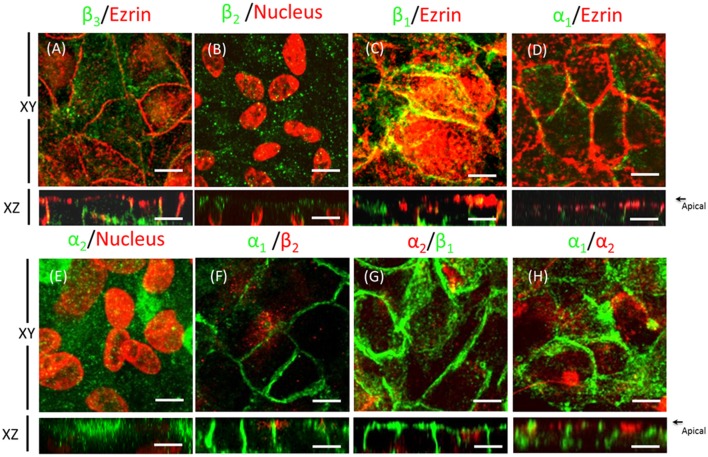
Figure 6.
Domain-specific distribution of the Na+, K+-ATPase isoforms in ARPE-19 cells. Immunofluorescence assays of ARPE-19 cells cultured for 4 weeks with ITS. (A–E) Fluorescence images of immunostaining with isoform-specific antibodies against the α and β subunits of Na+, K+-ATPase; co-staining with anti-ezrin as an apical marker (A,C,D) or counterstaining with propidium iodide for the detection of nuclei (B,E). β3 (A) and α1 (D) subunit expression was detected mainly in the lateral domain. The distribution pattern of the β2 and α2 subunits (B,E) suggests an apical localization. The distribution pattern of the β1 subunit (C) in both the lateral and apical domains suggests non-polarized expression. Minor co-localization with ezrin at the apical domain is observed. The α1/β2 (F), α2/β1 (G) and α1/ α2 subunits (H) do not co-localize. Scale bar: 10 μm.

