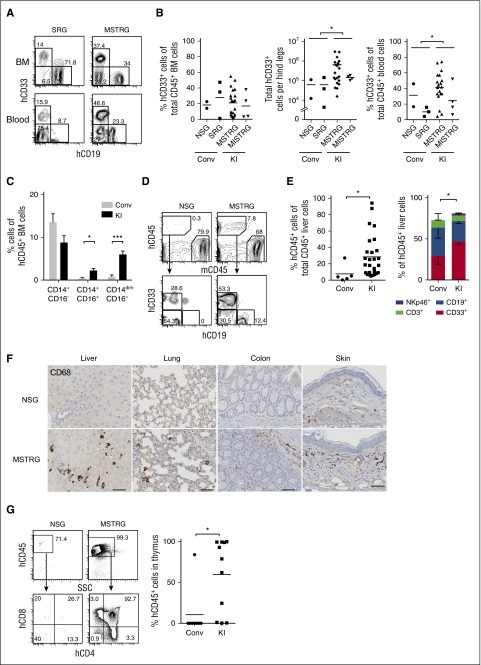
Figure 2.
Human cell engraftment in lymphoid and nonlymphoid tissues in newborn recipients. (A) Representative FACS plots for hCD19+ and hCD33+ cells gated on hCD45+ cells in BM (top panels) and PB (bottom panels). (B) Frequency and absolute number of hCD33+ cells in BM (left) and frequency of hCD33+ cells in PB (right). Each plot shows data from an individual recipient engrafted with hCD45+ cells. Numbers beside gates indicate percentages of cells; n = 5 (Conv; 2 NSG and 3 SRG), n = 20 (KI; 16 MSTRG and 4 MISTRG). *P < .05 (Mann-Whitney U test). (C) Frequency of classical (CD14+CD16−) and nonclassical monocytes (CD14+CD16+ or CD14dimCD16+) among lineage (Lin; CD3, CD19, CD20)− hCD45+ cells in BM of engrafted recipient mice; data show mean + standard error of the mean; n = 5 (Conv; 2 NSG and 3 SRG), n = 22 (KI; 18 MSTRG and 4 MISTRG). *P < .05; ***P<.001 (Mann-Whitney U test). (D) Representative FACS plots of recipient mice (in liver 14 weeks posttransplantation) for hCD45+ cells (top panels), CD33+ or CD19+ cells gated on hCD45+ cells (bottom panels). Numbers beside gates indicate percentages of cells shown. (E) Percentage of hCD45+ cells among total CD45+ cells in liver (left graph); each symbol represents an individual recipient engrafted with hCD45+ cells, and bars indicate mean values. CD33+, CD19+, CD3+, and NKp46+ population among hCD45+ cells in the liver of engrafted mice (right); data show mean + standard error of the mean; n = 5 (Conv; 2 NSG and 3 SRG), n = 25 (KI; 21 MSTRG and 4 MISTRG). *P < .05 (Mann-Whitney U test; left) and *P < .05 (for CD33+ cells, 1-way ANOVA Kruskal-Wallis test with Dunn’s multiple comparison test; right). (F) Immunohistological staining of human myeloid cells (hCD68+) in nonlymphoid tissues (liver, lung, colon, and skin) of recipient mice. Bars represent 20 μm. Images are representative of at least 3 mice analyzed per group. (G) Representative FACS plots for hCD45+ cells (top panels) and double-negative, double-positive, CD4+ single-positive, and CD8+ single-positive thymocytes among hCD45+ cells (bottom panels) in the thymus of indicated recipient mice. Number of hCD45+ cells in the thymus is shown (right). Each symbol represents an individual recipient engrafted with hCD45+ cells; bars indicate mean values; n = 4 (Conv; 2 NSG and 2 SRG), n = 9 (KI; 9 MSTRG). *P < .05; ***P < .001 (Mann-Whitney U test).

