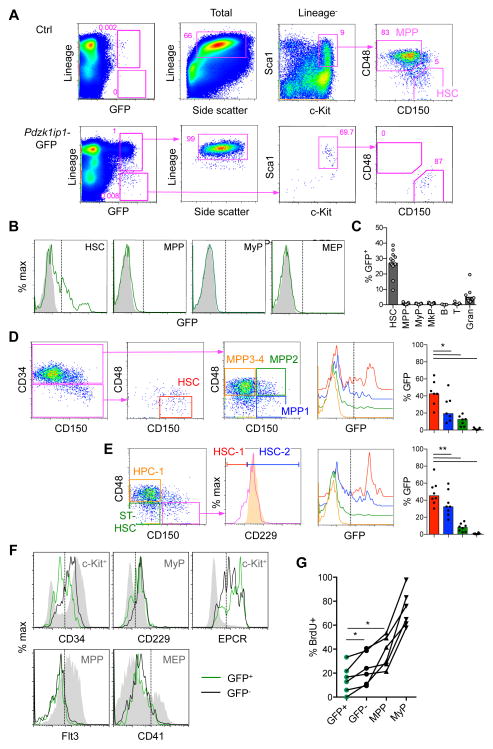
Fig. 1. Pdzk1ip1-GFP is expressed in a fraction of adult bone marrow HSCs.
A. The expression of GFP within the total BM cells of adult Pdzk1ip1-GFP mice and the phenotype of gated GFP+ cells. The phenotypes of total or Lin− cells from control non-transgenic BM are shown for comparison. Note that GFP+ Lin+ cells correspond to SSChi granulocytes and GFP+ Lin− cells correspond to HSCs.
B. Representative histograms of GFP expression in HSCs (LSK CD48− CD150+), MPPs (LSK CD48+ CD150−), MyPs (Lin− Sca1− cKit+ CD150−), and MEPs (Lin− Sca1− cKit+ CD150+) from Pdzk1ip1-GFP and control non-transgenic animals.
C. The fraction of GFP+ cells within the indicated BM populations (MkP defined as Lin− Sca1− cKit+ CD150+ CD41+; B, B220+; T, TCRβ+; Gran, Gr1+ CD11b+ SSChi). Bars represent medians of individual animals shown (n=13 for all cells except lymphocytes, for which n=5).
D. The expression of GFP in the HSC and progenitor (MPP1–4) populations defined according to (Cabezas-Wallscheid et al., 2014; Wilson et al., 2008) and the fraction of GFP+ cells within each population (bars represent medians of individual animals shown, n=7).
E. The expression of GFP in the HSC (HSC-1 and HSC-2) and progenitor (MPP and HPC-1) populations defined according to (Oguro et al., 2013). The expression of CD229 in the HPC-1 population is shown as a control (orange shadow histogram). Bars represent medians of individual animals shown (n=8).
F. Expression of surface markers in GFP+ and GFP− HSCs. Control populations showing the expression range of each marker are shown as grey shadow histograms. Representative of 3 individual animals.
G. The fraction of GFP+ and GFP− HSCs and progenitors (MPPs and MyPs) that incorporated BrdU after a 3-day pulse. Shown are values from 6 individual animals. Statistical significance: *p ≤ 0.05; **p ≤ 0.01.
See also Fig. S1.

