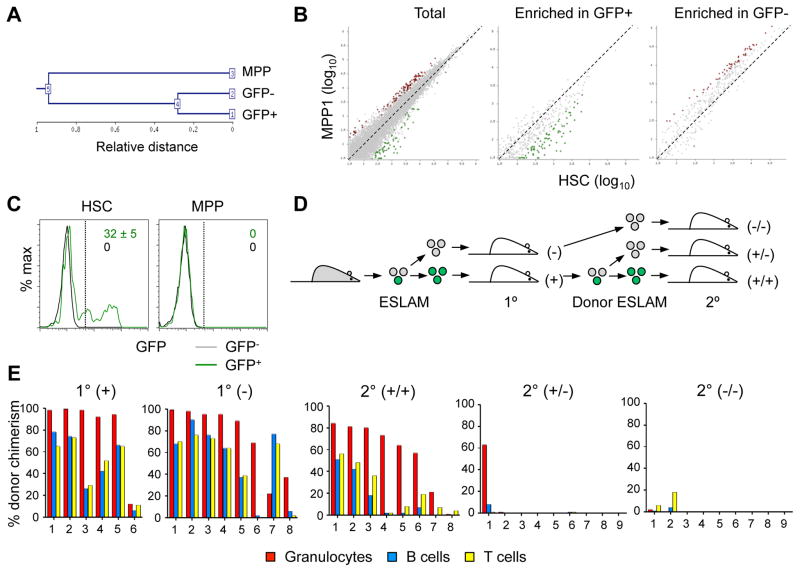
Fig. 2. Pdzk1ip1-GFP+ HSCs have an undifferentiated expression profile and serial reconstitution capacity.
A–B. RNA-Seq analysis of GFP+ and GFP− HSCs and MPPs from Pdzk1ip1-GFP mice. A. Unsupervised clustering dendrogram of the three samples.
B. Comparison with RNA-Seq profiles of wild-type HSCs and their immediate progeny (MPP1) (Cabezas-Wallscheid et al., 2014). Shown is pairwise comparison of transcript frequencies in HSCs and MPP1 for all genes (total) or for genes enriched in the GFP+ or GFP− HSCs from Pdzk1ip1-GFP mice (Dataset S1). Genes increased >2-fold in HSCs or MPP1 are highlighted in green or red, respectively.
C. The fraction of GFP+ cells in donor-derived HSCs and MPPs of primary recipients reconstituted with either GFP+ or GFP− HSCs six months post-transplant (mean ± S.D. of 5 recipients).
D. The design of experiment to assess the ability of 20 sorted GFP+ (green) or GFP− (grey) CD45+ EPCR+ CD150+ CD48− (ESLAM) HSCs to reconstitute hematopoiesis in the primary (1°) and secondary (2°) recipients.
E. The fraction of donor-derived cells among different blood cell lineages in recipients assessed at least 16 weeks post-transplant in primary and secondary recipients of 20 ESLAM HSCs. Shown are values for individual recipient mice pooled from two independent experiments.
See also Fig. S2 and Dataset S1.

