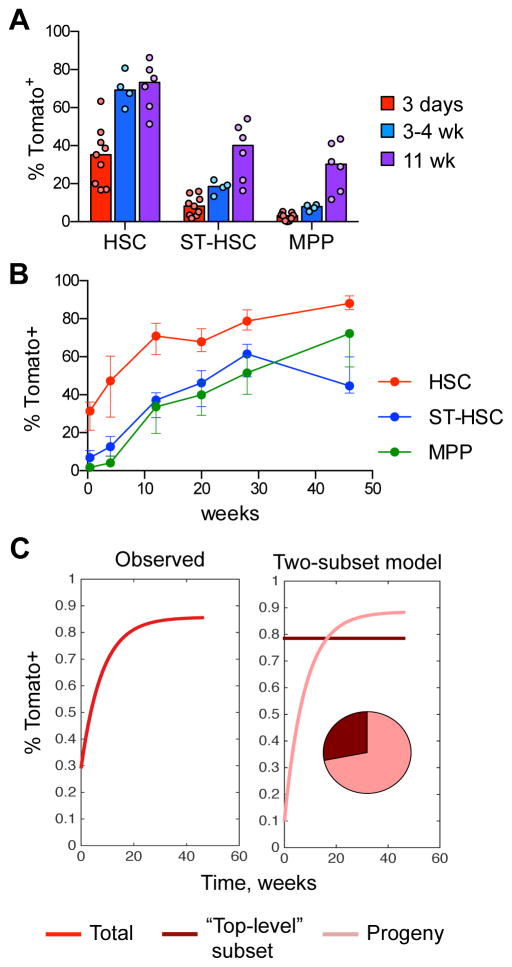
Fig. 4. Labeled HSCs give rise to other cells within the HSC population.
A. The fraction of labeled Tom+ cells in the HSC/progenitor compartment of Pdzk1ip1-CreER R26Tom/Tom reporter mice. The HSC and progenitor subsets within the LSK population were defined on the basis of CD150/CD48 expression as shown in Fig. S4A. Shown are the median (bars) and individual values (circles) for animals sacrificed at 3 days, 3–4 weeks or 11 weeks after tamoxifen treatment.
B. Continuous analysis of Tom+ cells in the HSC/progenitor compartment of tamoxifen-treated reporter mice by serial BM biopsy. Shown is the fraction of Tom+ cells in HSC/progenitor subsets in the same animals over time (median ± interquartile range, n= 5).
C. The dynamics of Tom+ label accumulation in the HSC compartment (left) and its decomposition into two-subset model (right). The modeled composition of the HSC compartment is shown as a pie diagram. The labeled fraction of “top-level” HSCs is assumed to be constant since they are fully self-renewing while the labeled fraction of their progeny is steadily growing.
See also Fig. S4.

