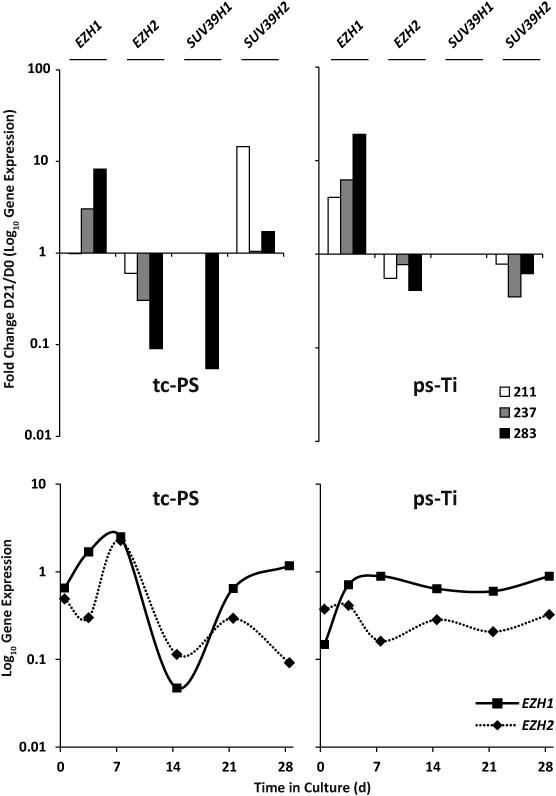
Figure 7.
Mini-screen of epigenetic regulators related to bone (EZH1, EZH2, SUV39H1, and SUV39H2) as fold change of expression on D21 vs D0. Time course data showing temporal changes in mRNA levels consistent with results of the analysis of selected epigenetic regulators on tc-PS versus ps-Ti for a representative patient (AMSC 211).

