Abstract
The N-glycan of the IgG constant region (Fc) plays a central role in tuning and directing multiple antibody functions in vivo, including antibody-dependent cellular cytotoxicity, complement deposition, and the regulation of inflammation, among others. However, traditional methods of N-glycan analysis, including HPLC and mass spectrometry, are technically challenging and ill suited to handle the large numbers of low concentration samples analyzed in clinical or animal studies of the N-glycosylation of polyclonal IgG. Here we describe a capillary electrophoresis-based technique to analyze plasma-derived polyclonal IgG-glycosylation quickly and accurately in a cost-effective, sensitive manner that is well suited for high-throughput analyses. Additionally, because a significant fraction of polyclonal IgG is glycosylated on both Fc and Fab domains, we developed an approach to separate and analyze domain-specific glycosylation in polyclonal human, rhesus and mouse IgGs. Overall, this protocol allows for the rapid, accurate, and sensitive analysis of Fc-specific IgG glycosylation, which is critical for population-level studies of how antibody glycosylation may vary in response to vaccination or infection, and across disease states ranging from autoimmunity to cancer in both clinical and animal studies.
Keywords: IgG N-Glycosylation, Capillary Electrophoresis
1. Introduction
Beyond their ability to neutralize pathogens, antibodies are able to mediate an array of effector functions through their interaction with Fc-receptors, complement molecules, and mammalian lectin-like molecules (Kapur et al., 2014). While the neutralizing activity of an antibody is mediated largely by its variable domain (Fab, antigen-binding fragment), its ability to perform extra-neutralizing functions is determined by the constant domain (Fc, crystallizable fragment) (Schroeder and Cavacini, 2010). Though the Fc is referred to as constant, it is in fact variable in two major aspects: a) protein sequence varies through subclass or isotype selection (Nimmerjahn and Ravetch, 2010) and b) glycosylation variation of N-linked glycans which change rapidly during an immunologic response (Xue et al., 2013). Together, these alterations in the antibody Fc significantly modify the effector function of antibodies, such as antibody-dependent cellular cytotoxicity (ADCC) (Davies et al., 2001; Shields et al., 2002; Shinkawa et al., 2003; Shoji-Hosaka et al., 2006) and complement-dependent cytotoxicity (CDC) (Karsten and Köhl, 2012). While high-throughput methods are available to profile the isotype/subclass selection profile of polyclonal antibody pools (Brown et al., 2012), comparable methods for efficient analysis of glycan profiles are not available.
Studies of therapeutic monoclonal antibodies have clearly demonstrated the critical nature of the antibody glycan; ADCC activity is significantly increased in monoclonal therapeutic antibodies that lack fucose (Shields et al., 2002; Shinkawa et al., 2003; Shoji-Hosaka et al., 2006) or contain a bisecting N-Acetylglucosamine (GlcNAc) {Davies:2001hq, Goede:2014ey}. In addition to their role in determining effector function, inflammatory responses are dramatically modulated by Fc glycosylation. In particular, the addition of terminal sialic acids to the Fc glycan results in the induction of a potent anti-inflammatory response (Anthony and Ravetch, 2010; Böhm et al., 2012). Moreover, population level studies have shown that IgG glycosylation varies significantly with age, pregnancy, and during autoimmune-disease flares (Chen et al., 2012; Keusch et al., 1996; Parekh et al., 1988; Van De Geijn et al., 2009). More recent analyses point to antigen-specific antibody glycan alterations suggesting IgG-glycosylation is specifically programmed during immune responses (Ackerman et al., 2013; Collin and Ehlers, 2013; Selman et al., 2012; Yamada et al., 2013).
Studies of IgG-glycosylation in vivo have been historically limited by the low-throughput of existing analytical techniques, which generally require prohibitively expensive instrumentation and large quantities of sample, thus limiting the scope of research into natural regulation of IgG-glycosylation. Traditional approaches to analyze IgG N-glycosylation have relied primarily on high performance liquid chromatography (HPLC) or mass spectrometry (MS), both of which require relatively large quantities of material/antibody for accurate analysis as well as significant time and expertise to acquire and analyze data (Huhn et al., 2009). While MS offers remarkable structural resolution of N-glycans, it is poorly quantitative. On the other hand, while HPLC is highly quantitative, it is expensive, and both methods are distinctly low throughput. As studies of IgG glycosylation begin to focus on in vivo modifications, both in human populations and in animal models, the volume of samples often decrease as the number of samples increases. Thus a clear need exists for the development of a simple technique that combines sensitive quantitation with high-throughput capacity.
Capillary electrophoresis (CE) offers a unique high-throughput, quantitative analytical tool for the analysis of antibody glycosylation. Specifically, the use of common DNA sequencing equipment to perform glycan structure analysis by capillary electrophoresis is an excellent alternative to the established methods, with advantages in simplicity, throughput, structural resolution, and sensitivity (Callewaert et al., 2001; Huhn et al., 2012; Laroy et al., 2006; Reusch et al., 2014). Previously described CE techniques for antibody glycan analysis have focused on the analysis of whole IgG, as the large majority of monoclonal antibodies lack Fab glycan-sites (Ritamo et al., 2014). However, as many as 30% of serum-derived Fab fragments contain an N-glycosylation motif, and Fab glycans differ significantly from those typically found on the Fc-domain, in particular, Fab N-glycans contain higher proportions of sialic acid and fewer fucosylated structures (Anumula, 2012; Holland et al., 2006; Mimura et al., 2007). Thus, studies interrogating polyclonal antibody glycosylation aimed at understanding the functional significance of these regulated post-translational modifications will depend on the ability to resolve Fc and Fab glycans separately.
Here we describe a high-throughput, inexpensive, sensitive, and accurate approach for IgG N-glycan analysis of polyclonal antibodies. This methodology allows for separate analysis of the N-glycans from whole IgG, Fc, or Fab domains using capillary electrophoresis performed on a DNA-sequencer, providing a fast, accurate, quantitative, and relatively inexpensive and simple tool to probe IgG glycosylation, even when sample quantities are limited. This technique will be useful for the analysis of changes in antibody glycosylation following vaccination, in natural infection, as well as in non-infectious pathological conditions both in humans and in animal models, facilitating our understanding of the immunological impact of a B cell's ability to tune antibody activity through variations in glycosylation.
2. Materials and methods
2.1 Samples
Optimization of digestion and separation conditions was performed on commercially available, pooled IgG from healthy donors (Sigma Aldrich, human IgG and mouse IgG) or a pool of IgGs purified from healthy rhesus monkeys (Non-Human Primate Reagent Resource). Healthy human subjects were recruited through Brigham and Women's Hospital PhenoGenetic Project. The Institutional Review Board of Partners Healthcare approved the study, and each subject gave written informed consent. Rhesus macaque plasma was obtained from healthy, non-immunized animals, provided by D. Barouch. The Harvard Medical School Institutional Animal Care and Use Committee (IACUC) approved all studies involving rhesus monkeys. Plasma from C57/Bl6 mice was purchased from the Jackson Laboratory (Bar Harbor, Maine).
2.2 Isolation of IgG
Human and rhesus plasma was collected from fresh blood drawn in ACD tubes by centrifugation and frozen at −80°C. IgGs from human and rhesus were isolated using Melon Gel IgG purification resin (Thermo Fisher) according to the manufacturer's instructions. Mouse IgG was isolated using protein A/G columns (Thermo Fisher) and eluted in 0.1M citrate buffer pH 2.9, and subsequently neutralized in potassium 0.1M phosphate buffer pH 8.9. All IgGs were isolated and stored in buffers without primary amines, to avoid problems with downstream glycan labeling. IgG concentrations were determined by measuring A280 on a Nanodrop spectrophotometer.
2.3 Removal of N-glycan from protein
Once IgG was purified, glycans were released from protein using enzymatic digestion with Peptide-N-Glycosidase F (PNGaseF, New England Biolabs). Protein was denatured using 2 μl of the provided denaturation buffer and incubated at 95°C for 10 minutes according to the manufacturer's instruction. Samples were cooled on ice before the addition of 4 μl of G7 digestion buffer provided by the manufacturer, 4 μl of 10% NP-40, 375 Units of PNGaseF and water to a total volume of 40 μl. The reaction mixture was incubated at 37°C for 30 minutes. Two hundred microliters of ice-cold ethanol was added to each well to precipitate protein and separate released glycans. Plates were incubated for ten minutes at −20°C and precipitated proteins, including enzymes, protein coated beads, and deglycosylated IgG fragments, were pelleted by centrifugation at 2700x g for ten minutes. Glycan containing supernatants were transferred to fresh plates and dried completely in a Labconco centrivap. Dried glycans can be stored at −20°C indefinitely.
2.4 Labeling and cleanup of free glycan for CE
Thoroughly dried glycans were labeled by reductive amination using 2 μl of a 1:1 mixture of 25mM 8-aminopyrene-1,3,6-trisulfonic acid, APTS (Life Technologies) in 1.2M citric acid and 1M sodium-cyanoborohydride in THF (Sigma Aldrich). Plates were sealed tightly and the reduction reaction proceeded protected from light at 55°C for 3 hours. Unreacted dye was removed using fresh size-exclusion columns, prepared by pipetting 250 μl of 50% P2 gel slurry (BioRad) to the wells of an 96 well empty filter plate (Harvard Apparatus), packed by centrifugation at 750 xg for 1 minute and washed with 100 μl of ultrapure water. Fluorescently labeled glycans were resuspended in 60 μl of ultrapure water and applied directly to the top of the packed size-exclusion columns in the filter plate. These were spun at 750 xg for 2 minutes, releasing labeled glycan in the flow-through. Glycans were stored at 4°C until analysis on a DNA sequencer, up to 6 months without altering signal.
2.5 Electrophoretic separation and analysis of glycan
One microliter of each sample was diluted 1:10 in ultrapure water in a 96-well PCR plate and loaded onto a 3130XL ABI DNA sequencer. Parameters for run are as described (Laroy et al., 2006) using POP7 polymer in a 36cm capillary. Acquisition software was set to export data as .fsa files.
Data was exported from acquisition software as .fsa, which were converted to .xml using conversion software provided by Applied Biosystems (http://www.appliedbiosystems.com/absite/us/en/home/support/software-community/tools-for-accessing-files.html). Converted files were analyzed using MATLAB (The MathWorks, Inc) to align peaks and calculate the area under the curve for each peak using a custom designed script.
2.6 Glycan peak identification
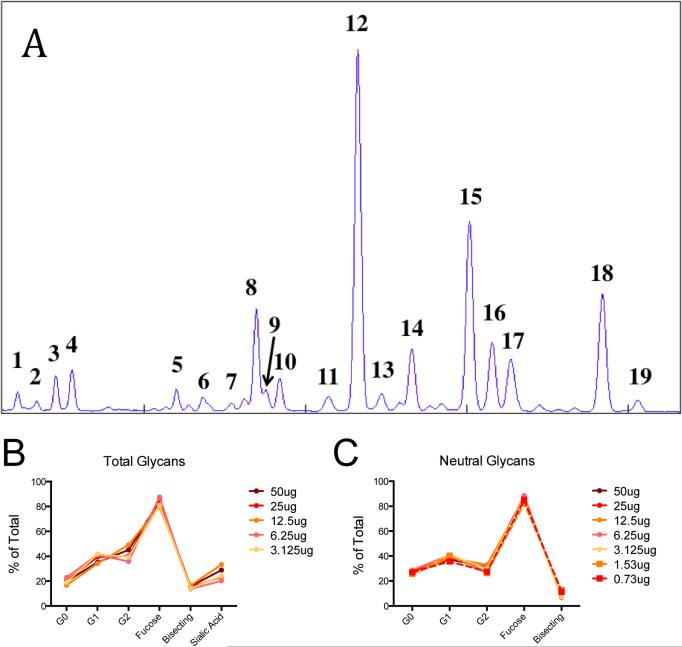
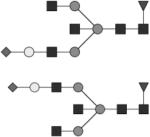
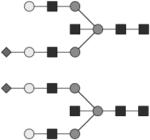
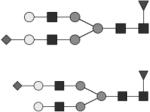
Individual fluorescently labeled glycans pass through the acrylamide matrix at a rate dependent on both the size and charge of the glycan. The APTS dye provides charge to all the molecules to allow for electrophoretic migration. Sialylated species contain additional charge depending on the number of sialic acids and thus travel fastest through the matrix. To identify peaks, including high mannose structures, known glycan standards (Prozyme) were labeled with APTS as described for IgG glycans and spiked into human IgG-derived samples. Prozyme standards and IgG-derived glycans were digested with exoglycosidases (NEB) to determine additional structures, see Table 1 and Figure 1.
Table 1.
Structure, glycan name and CE peak assignment.
| Glycan Structure | Structure Name | CE Peak Assignment |
|---|---|---|
|
|
G2S2 | 1* |

|
G2S2B | 2 |
|
|
G2S2F | 3* |

|
G2S2FB | 4 |

|
G1S1 | ND |
|
G1S1B | ND |
|
G1S1F | 5* |
|
G1S1FB | ND |

|
G2S1 | 6* |
|
G2S1B | 7 |
|
G2S1F | 8* |

|
G0 | 9* |

|
G0B | ND |
|
|
G2S1FB | 10 |

|
G0F | 12* |
|
|
G1 | 11 & 13* |

|
G0FB | 14 |
|
|
G1B | ND |
|
|
G1F | 15 & 16* |
|
|
G1FB | 17 |
|
|
G2 | ND |

|
G2B | ND |

|
G2F | 18* |

|
G2FB | 19* |
For clarity in reporting the results, the 21 individual structures that we observe are categorized into six major groups: agalactosylated (G0), monogalactosylated (G1), digalactosylated (G2), fucosylated (F), bisected (B), and sialylated (SA), as described in Table 2.
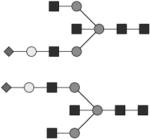
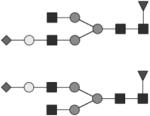
Glycan structures are represented using standard symbolic representation (GlcNAc = black square, mannose = gray circle, galactose = white circle, sialic acid = gray diamond, fucose = gray triangle) (Harvey et al., 2009). Structures are assigned to peaks as shown in Figure 1A. ND = not detected.
indicates that peaks were identified using commercially available standards, or exoglycosidase digested standards.
Figure 1. Glycan analysis by capillary electrophoresis is sensitive.
Example CE spectrum of human IgG with peaks identified as described in Table 1 (A). Proportions of individual structures were summed as described in Table 2, and the total proportion of each category of structures are expressed for decreasing amounts of the same sample of intact IgG. The proportion of total glycan structures (B) are compared with only neutral (asialylated) glycan structures (C).
For clarity in reporting the results, the 21 individual structures that we observe are categorized into six major groups: agalactosylated (G0), monogalactosylated (G1), digalactosylated (G2), fucosylated (F), bisected (B), and sialylated (SA), as described in Table 2.
Table 2.
Major categories of glycan structures.
| Category | Specific Peaks (Peak Number from Table 1, ND=Not Detected) |
|---|---|
| Agalactosylated (G0) | G0 (9), G0B (ND), G0F (12), G0FB (14) |
| Monoalactosylated (G1) | G1 (11 & 13), G1F (15 & 16), G1B (ND), G1FB (17), G1S1 (ND), G1S1F (5), G1S1B (ND), G1S1FB (ND) |
| Digalactosylated (G2) | G2 (ND), G2F (18), G2B (ND), G2FB (19), G2S1(6), G2S1F (8), G2S1B (7), G2S1FB (10), G2S2 (1), G2S2F (3), G2S2B (2), G2S2FB (4) |
| Fucosylated | G0F (12), G0FB (14), G1F (15 & 16), G1FB (17), G1S1F (5), G1S1FB (ND), G2F (18), G2FB (19), G2S1F (8), G2S1FB (10), G2S2F (3), G2S2FB (4) |
| Bisected | G0B (ND), G0FB (14), G1B (ND), G1FB (17), G2B (ND), G2FB (19), G1S1B (ND), G1S1FB (ND), G2S1B (7), G2S1FB (10), G2S2B (2), G2S2FB (4) |
| Sialic Acid | G1S1 (ND), G1S1F (5), G1S1B (ND), G1S1FB (ND), G2S1 (6), G2S1F (8), G2S1B (7), G2S1FB (10), G2S2 (1), G2S2F (3), G2S2B (2), G2S2FB (4) |
Individual glycan structures, as described in Table 1 are summed into categories based on their galactosylation (G0, G1 or G2), fucosylation, sialylation or bisection (with GlcNAc).
2.7 HPLC analysis of IgG glycan
IgG samples were separated by SDS PAGE on 4-12% Bis-Tris gels (Life Technologies, UK) and stained with Coomassie blue stain for 30 minutes. Gel bands were excised and alternately washed with 100% Acetonitrile and ultrapure water until the gel bands were sufficiently dehydrated. Following this, gel bands were incubated overnight at 37°C with 100 U/ml of PNgaseF (New England Biolabs, UK) in 30 μl distilled water. The following day, free glycans were eluted by serial washing of gel slices with distilled water. Eluted glycans were dried down in a centrifugal evaporator (Vacufuge plus, Eppendorf, Germany) and labeled with 2 aminobenzoic acid (2-AA) using the Ludger 2-AA labeling kit and clean up cartridges (Ludger, Culham, UK).
Normal phase high performance liquid chromatography was used to separate and analyze the 2-AA labeled N-glycans. Samples were injected into a Ludger amide HPLC column (150mm length and 4.6mm internal diameter) on an Alliance Waters 2695 separation module fitted with a Waters 2475 multi wavelength fluorescence detector (λex 330nm and λem 420nm). The solvent gradient started with 35% Ammonium Formate (50mM, pH 4.4) and 65% Acetonitrile at 1ml/min and was gradually increased to 100% Ammonium Formate over 22.5 minutes and then subsequently gradually decreased back to 35% Ammonium Formate over the next 7.5 minutes. Peak assignments were confirmed by comparison with standards (Ludger 2AA labeled IgG Glycan library) and also with previous mass spectrometric profiles of IgG glycans.
2.8 Digestion of IgG into Fab and Fc fragments
Purified human and rhesus IgG were digested into Fc and F(ab’)2 fragments using IdeS, Immunoglobulin G degrading enzyme of S. pyogenes (FabRICATOR, Genovis, Sweden). Twenty micrograms of purified human IgG, at a concentration of 1 mg/ml in PBS, was digested with two-fold serial dilutions between 0.625 and 40 Units of enzyme for 1 hour at 37°C. Rhesus IgG required 18 hours incubation at 37°C to fully digest the same amount of IgG. Because mouse IgG is resistant to IdeS cleavage, the Streptococcal cysteine protease SpeB (FabULOUS, Genovis, Sweden) was used to degrade the sample into Fd (digested fragment containing the variable region of the heavy chain) and Fc fragments. Twenty micrograms (at 1 mg/ml), of murine IgG was digested with two-fold dilutions of SpeB between 0.625 and 10 Units in 1% beta-mercaptoethanol for 1 hour at 37°C.
Analysis of IgG fragmentation and separation was performed using precast 4-12% Bis-Tris gradient gels (Life Technologies). Protein was loaded at 5 μg per lane alongside a prestained ladder and bands were visualized using Coomassie. Band intensity was quantified using GelQuant.NET software provided by biochemlabsolutions.com.
2.9 Separation of Fc and Fab fragments
To separate the digested fragments, protein G (for human and rhesus) or protein A (for mouse) coated magnetic beads (Millipore) were used to bind and enrich the Fc portions. In a 96 well PCR plate, 1, 5, 10, 15, 20, or 30 μl of protein A or G beads were added to each well. Beads were washed twice with 200 μl PBS, using a 96 well magnetic plate to immobilize beads (SPRIPlate Beckman Coulter). Digested IgG was diluted in 80 μl of PBS and the entire volume was transferred to the plate containing washed beads. Plates were sealed tightly and incubated at room temperature with vortexing for 1 hour. Plates were spun down and set into the magnet for five minutes to separate beads. F(ab’)2 and Fab fragments, which bind poorly to protein A and G, remained in the supernatant, along with IdeS or SpeB, which contain no N-glycosylation sites and thus do not interfere with glycan analysis. The supernatant fraction was removed and dried to approximately 18 μl in a Labconco Centivap to concentrate Fab protein. The bead-bound fraction contained Fc and any incompletely digested IgG. The beads were washed twice in 200 μl of PBS and brought up in 18 μl of PBS or water. Neither protein G nor the magnetic beads contain any N-linked glycans, so glycan release can occur without removing beads, and the fragments were processed as described for intact IgG.
3. Results
3.1 Analysis of glycans on the DNA sequencer is highly sensitive and reproducible
To test our glycan analysis technique, IgG glycans were enzymatically released, purified, fluorescently labeled and eletrophoretically separated on the DNA sequencer as described in the methods section. Individual peaks on the CE spectrum, as shown in Figure 1A, were identified using standards and exoglycosidase digestion as described in Table 1. Individual glycan strutures were broadly classified into categories as described in Table 2. These categories give a broad description of the inflammatory profile (galactosylation and sialylation) and the effector functionality (fucosylation and bisected-GlcNAc-containing) profile of the polyclonal IgG population, providing a simplified and more easily interpreted snapshot of the glyco-profile of each sample.
Next, we sought to establish the level of sensitivity of this analytic platform. Using the CE technique described, starting at 50 μg two-fold serial dilutions of total human IgG were analyzed. We observed that reliable signals could be collected for several categories of glycan structures using as little as 3.125 μg of starting IgG (Figure 1B), a quantity present in approximately 1 μl of plasma. Moreover, analysis of neutral (asialylated) glycans was more sensitive, with robust signals over background detected using as little as 0.73 μg of IgG (Figure 1C), equivalent to less than 0.1 μl of plasma. The lower sensitivity for sialylated glycan detection likely results from the fact that sialylated glycans elute most rapidly, along with unreacted dye, which may reduce the resolving power of these structures in the samples with low input and subsequent low signal to noise ratio. Thus the acquisition of the highest quality sialated glycan species may require larger glycan input to overcome the signal to noise ratio necessary for accurate detection. However, we have shown that glycans can be resolved using as little as 0.73 μg of input IgG, while sialylated glycans may only be acurately quantified at a minimum of 2-fold more input material.
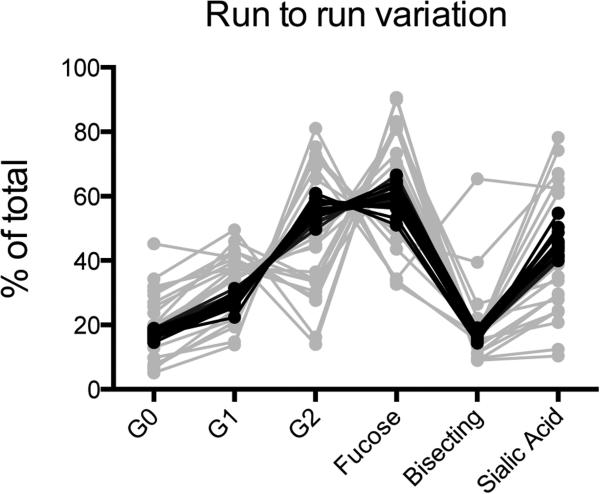
To begin to dissect the variation and reproducibility of this technique, two independent experiments were performed: a) one sample was prepared and run twenty independent times to measure reproducibility, and b) twenty purified immunoglobulin samples from different healthy human donors were run at once to quantify the level of variation within a population sample set (Figure 2). Critically, the coefficient of variation [(Standard deviation of all runs / Average of all runs) × 100%] calculated for a) was below 8% for each structure, demonstrating robust reproducibility. In contrast, average variation from the mean among samples from different subjects ranged from 30 and 70%, with some structures being highly variable, including bisecting GlcNAc-containing, agalactosylated and sialylated structures. This result demonstrates the feasibility of accurately detecting variation within populations and changes within an individual over time.
Figure 2. Glycan analysis by capillary electrophoresis is reproducible and shows dramatic variation among subjects tested.
Total proportions of glycan structure categories, as described in Table 2 are represented for one sample prepared and analyzed 20 times, black lines, highlighting the robustness of the assay. Additionally the grey lines represent data for 20 different samples analyzed simultaneously, reflecting the tremendous variation in glycan abundance among subjects.
3.2 Capillary electrophoresis is comparable to HPLC
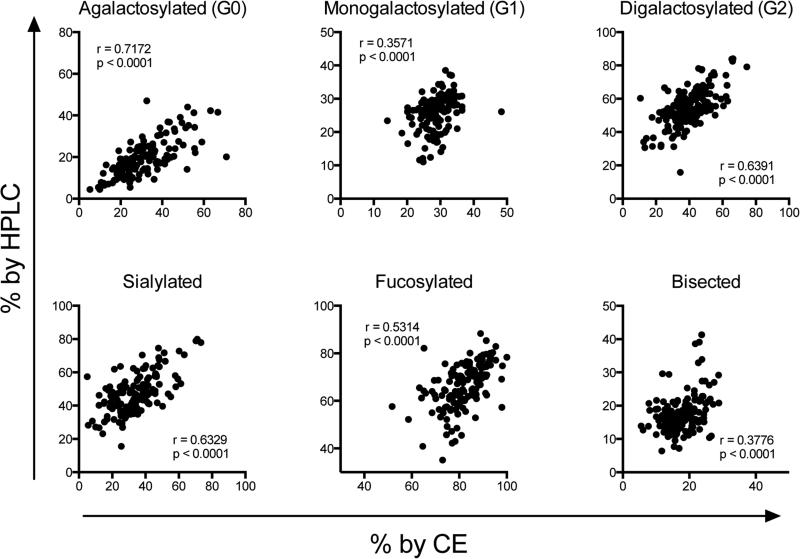
Traditionally, glycan analysis is perfomed using MS or HPLC. These techniques benefit from decades of standardization and are considered gold-standards for glycan analysis. While ultra-performance liquid chromatography can use very small volumes of sample, each run takes approximately two hours. While sample preparation time is similar for HPLC and CE, the advantages of capillary electropheresis for antibody glycan analysis include lower cost, ease of use, increased sensitivity, and most criticially, increased data output due to the speed of individual runs and the ability to run multiple capillaries at once, depending on the sequencer. Therefore, we sought to determine the accuracy of CE compared to HPLC. When we compared the samples run by HPLC versus CE (Figure 3), we observed excellent concordance between the techniques for every structure category. Importantly, while the proportions of all structures were significantly correlated, some discrepancy was observed in the absolute numbers of the structures calculated, which is likely due to difference in sample preparation and labeling chemistry. Overall, these results clearly illustrate that any changes in glycosylation that are measurable by HPLC can be reliably captured by CE.
Figure 3. Capillary electrophoresis compares favorably with HPLC.
Duplicate samples of intact human IgG were independently analyzed by capillary electrophoresis and HPLC. Spearman correlation coefficients were calculated (r values shown in each panel, n=142).
3.3 Fc and Fab are reliably separated by IdeS digestion
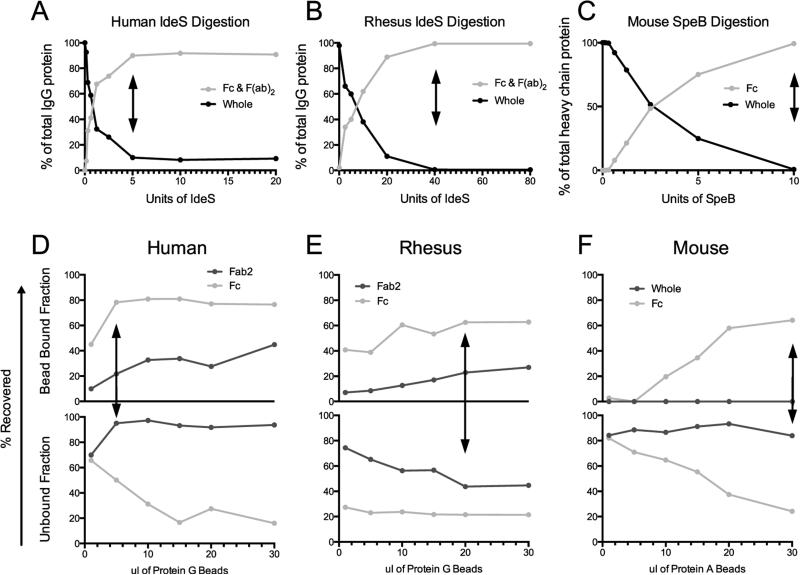
Between ten and thirty percent of serum polyclonal antibodies exhibit Fab glycosylation, which differ significantly from that of Fc, though only Fc domain glycosylation is known to directly impact effector function (Raju, 2008). Thus, successful and reliable separation of the Fc and Fab fragments of an antibody is critical for the characterization of the Fc-glycan modifications that are important for antibody functionality. Therefore, to limit the contribution of Fab-associated glycans to the overall glycan signal, we developed a high-throughput, 96 well plate-based method to separate IgG Fc from Fab domains. For human samples, digestion with 5 Units of IdeS is sufficient to separate 90% of the IgG into Fc and F(ab’)2 (Figure 4A). In contrast, 40 Units of IdeS were required for the digestion of rhesus IgG to achieve 99% digestion (Figure 4B). Finally, to digest murine IgG, 10 Units of SpeB enzyme was used to digest 92% of the IgG into Fc, Fd (digested fragment of the heavy chain containing the variable region) and light chain fragments (Figure 4C).
Figure 4. Enzymatic digestion fractionates mammalian IgG into Fc and Fab.
Enzymatic treatment with IdeS fractionates human IgG (A) and rhesus IgG (B) into Fc and F(ab)2 fragments, while SpeB was used to digest mouse IgG into Fc and Fab fragments (C). To separate the Fc fragments, magnetic protein G beads were used for human (D) and rhesus (E), while protein A separated fragments of mouse IgG (F). Arrows indicate the concentration of enzyme (A-D) or protein A or G (E-F) used for all subsequent experiments.
Next, either protein A or G was used to isolate the Fc fractions from the cleaved Fab portion of the antibody. For human IgG, 5 μl of magnetic protein G beads, which bind to all four subclasses of IgG, was sufficient to recover the maximum of 80% of total Fc while 90% of the F(ab)2 remained in the unbound fraction (Figure 4D). For rhesus, protein G exhibited lower binding of IgG, 60% of the Fc was recovered on 20 μl of beads, which contained less than 10% of contaminating F(ab)2 (Figure 4E). Finally, for murine IgG, protein A beads were used to maximize efficiency, 30 μl of beads was suitable to isolate 60% of total Fc with no contaminating Fab or whole IgG (Figure 4F).
3.4 Different fragments of IgG have significantly different glycosylation profiles
Unlike monoclonal antibodies, as many as 10-30% of total Fab fragments are glycosylated in a naturally produced, polyclonal mixture of antibodies (Ritamo et al., 2014). To date, modulation of Fab glycosylation in vivo has been largely overlooked, likely due to the cumbersome nature of the existing analysis techniques, so the role of Fab glycosylation in antibody function is poorly understood. However, it is known that different glycan structures are attached to the Fab domain, which are consistently more sialylated and less fucosylated than those on the Fc domain (Anumula, 2012). Thus, studies to profile glycan-mediated changes known to impact Fc-function must focus specifically on the Fc-glycan, rather than that of the intact antibody, as can be achieved by separating the Fc and Fab portions so that they can be easily analyzed in parallel.
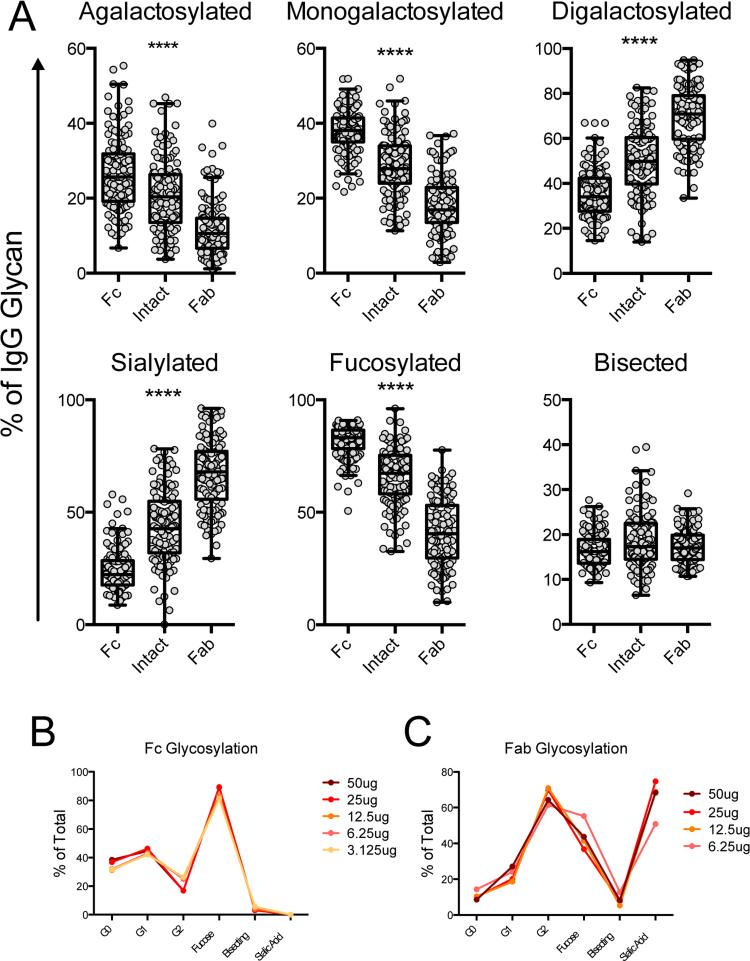
Analysis of each domain confirmed the significant disparity in sialylation and fucosylation of the glycan structures attached to each portion of the antibody (Figure 5A). Additionally, we observed differences in all structure categories except bisecting GlcNAc-containing structures, which were not significantly different between Fc and Fab fragments (Figure 5A). Given the importance of fucose content in driving ADCC activity (Niwa et al., 2004; Okazaki et al., 2004), the decreased proportion of fucosylation in the Fab fragments has the potential to significantly skew the interpretation of the functional capacity of a given antibody population if intact IgG glycans are analyzed. As would be expected, whole antibody consistently exhibited a glycosylation profile that was intermediate between the Fc and Fab profiles, showing that analysis of intact IgG likely obscures interesting variation of both Fc and Fab glycosylation. While many MS and HPLC techniques are performed on glycans released from the heavy chain of the antibody eliminate the light chain variable region-derived glycans, the inclusion of heavy chain variable domain-derived Fab glycans remains a limitation to specific assessment of the nature of Fc-glycan modulation, strongly arguing for independent, proteolytic-based separation and analysis of the IgG fragments.
Figure 5. Fc and Fab regions have different glycosylation patterns.
IgG was isolated from 125 human donors and analyzed using the described technique, including Fc and Fab separation. Structures were summed to make groups as described in Table 2 and plotted (A). Friedman paired ANOVA was performed to assess differences **** = p < 0.0001 among all groups. Sensitivity of detection of Fc (B) and Fab (C) fragments was determined as for intact IgG in Figure 1.
To determine the sensitivity of detection for the separate IgG fragments, we performed two-fold serial dilutions of intact IgG, starting at 50 μg, then fragmented and fractionated antibody before glycan release, separation, and analysis. By separating Fc from Fab, we observed a decrease in sialylation allowing for sensitivity of as little as 0.73 μg of starting IgG (Figure 5B). Conversely, Fab analysis was less sensitive, requiring at least 6.25 μg of IgG (Figure 5C), likely due to the high proportion of sialic acid containing glycans.
3.5 IgG glycan profiles in human, rhesus and mouse are significantly different
Experimental animal models, including rodents and non-human primates, play a critical role in the study and development of antibody and immunomodulatory therapeutics and vaccines against many diseases. Specifically, the non-human primate model of HIV, simian immunodeficiency (SIV), has played a central role in advancing our understanding of the correlates of protection from infection following vaccination, as well as understanding the protective role of non-neutralizing antibody activities in vivo (Asmal et al., 2011; Gómez-Román et al., 2005; Hessell et al., 2007). Thus, the application of CE-based Fc-glycan profiling to samples from non-human animal models may accelerate our understanding of the role and regulation of Fc-effector functions mediated by glycosylation.
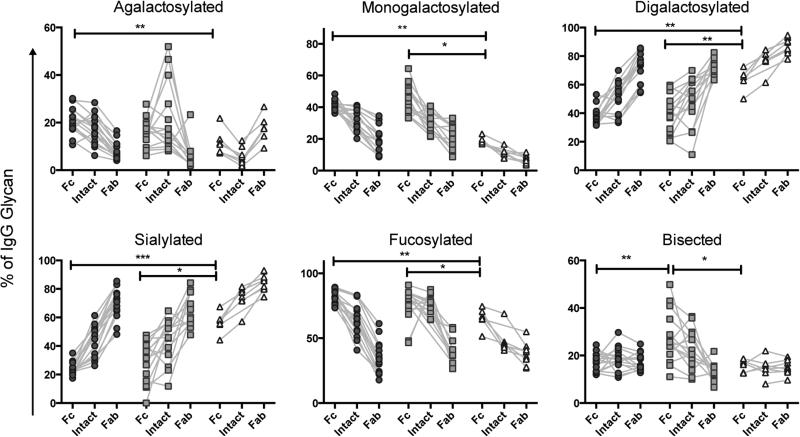
Accordingly, we modified our methods for human glycan analysis for the evaluation of rhesus IgG by using 40 Units of IdeS in an overnight digestion, followed by Fc separation using 30 μl of protein G beads. To isolate murine Fc, we used 10 Units of SpeB enzyme, as described in Section 2.4, and 30 μl of Protein A beads to separate the Fc from Fd and light chain fragments. These adaptations allowed us to successfully analyze whole, Fc and Fab portions of human, rhesus and mouse IgGs. While all three species have an attached complex biantennary glycan structure, the proportions of each specific structure vary significantly (Adamczyk et al., 2014; Raju et al., 2000). Interestingly, while rhesus and mice attach a sialic acid molecule known as N-Glyconeuraminic acid (NGNA), humans attach N-Acetylneuraminic acid (NANA) due to a genetic deletion of the NGNA producing enzyme over one million years ago (Angata et al., 2001; Chou et al., 1998; Ghaderi et al., 2010). However, this molecular difference does not impact our analysis since the two sialic acids behave similarly in their impact on glycan migration. We observed specific differences in the glycans from all three species, specifically, mice have significantly greater sialylation and lower agalactosylation than humans and rhesus (Figure 6). Additionally, mice appear to have lower fucosylation than primates. Finally, rhesus have more bisected Fc glycans, driven by an overall greater variance among animals (Adamczyk et al., 2014; Raju et al., 2000).
Figure 6. IgG glycosylation varies among species.
IgG isolated from human, rhesus, and mouse were analyzed for Fc, whole and Fab glycosylation by CE. Proportions of glycan structures were categorized as described in Table 2 and plotted with lines connecting fragments of the same sample. Statistics performed using Kruskal-Wallis ANOVA with Dunn's multiple comparisons test of Fc fragments only (* = p < 0.05, ** = p < 0.01, *** = p < 0.001).
Observation of these differences among mammals suggests a strong evolutionary pressure to diversify IgG glycosylation, perhaps in response to pressure from infectious agents. Thus use of this high-throughput robust analytical technique in experimental animal models may allow for both understanding of the impact of variant IgG glycosylation on immunity, but identification of mechanisms whereby antibody Fc-glycosylation may be tuned and ultimately rationally modified to drive production of functionally optimized antibodies. Collectively, the ability to apply Fc-targeted CE-based glycan analysis to diverse animal species reflects the versatility of this technique, and may aid in the clinical translation of studies performed in animal models.
4. Discussion
With growing appreciation of the role of antibody glycosylation in tuning antibody effector function, an analytical technique capable of analyzing the glycosylation profiles of large numbers of serum-derived, polyclonal antibodies is needed. Ultimately, an analytical tool aimed at characterizing antibody glycosylation in vivo must (a) have a high-throughput capacity, (b) exhibit robust reliability and sensitivity for Fc-specific glycan analysis in multiple species, (c) be cost-effective, and (d) be easy to implement in laboratories globally, requiring minimal specialized analytical staff. Here we present such a high-throughput, low-cost technique that additionally allows for rapid analysis and demonstrate its application to intact IgG, Fc, and Fab across multiple species.
In comparison to HPLC, capillary electrophoresis uses a similar, standardized set of techniques for glycan preparation and labeling. However, while HPLC takes as long as an hour to run a single sample, an ABI 3500 can analyze 24 samples simultaneously in the span of approximately 15 minutes, with the ability to load two 96 well plates simultaneously, thus enabling the processing of as many as one thousand samples in a day. In addition to its remarkable throughput, this approach demonstrates robust sensitivity, permitting full glycan analysis with small quantities of high-value samples, requiring as little as 1 μl of plasma. This high-throughput, sample-sparing technology is of particular importance in the clinical evaluation of vaccine trials that seek to profile the functional potential of vaccine-induced humoral immune responses in large populations.
Importantly, the cost of this assay is significantly lower than HPLC or MS. This cost-effectiveness is linked to reduced equipment and labor costs. Unlike HPLC or MS, which require specialized equipment and specially trained staff, any lab with access to a DNA sequencer can perform this assay. Core facility equipment is sufficient, as the protocol does not require permanent modifications to the sequencer and glycan analysis can be run alongside DNA samples with ease. Moreover, data analysis is user friendly, and can be done using any peak-area calculating software, including imageJ or customized MATLAB scripts, allowing widespread adoption. At a cost of less than 5 USD for labeling and running each sample, and with the possibility for further cost-reductions with process automation, this method could allow for the scale up required for the investigation of thousands of samples in longitudinal or cross-sectional studies, increasing the power to find meaningful results in large studies.
Since most studies of infection and vaccination begin in non-human animal studies, it is critical that a tool to assess antibody characteristics is applicable across species. Some important relationships between glycan structure and effector function are well conserved among mammals (Schwab et al., 2012) and IgG glycovariation may prove to be an important endpoint measure for vaccine efficacy. The technique described is easily adapted to either mouse or rhesus IgG samples and thus provides the ability to study humoral immune responses in both animal models and the clinic.
The existing study was performed on bulk IgG, which includes various subclasses depending on the species, IgG1-4 in human and rhesus, IgG1, 2a/b and 3 in mouse. Given the high sensitivity of the technique, future studies could be performed on purified IgG subclasses to characterize the differences in subclass glycosylation across cohorts. Additionally, the sensitivity allows for characterization of antigen-specific antibodies, which will contribute to our understanding of the pathogen-specific humoral response.
In order to support the evolving studies of antibody glycan variation, and its importance in tuning antibody functionality, particularly in the context of vaccines, we describe a high-throughput approach for the analysis of this immunological marker that is well suited to studies in large cohorts and animal models. Ultimately, because of the simplicity of this technique, and the wide distribution of DNA analyzers, we anticipate that this technique will expand the analysis of IgG glycosylation across a wide variety of cohorts including those collected for studies of aging, infectious disease, vaccination, autoimmunity, and more.
Highlights.
Reliable separation of Fc and Fab for glycan analysis
Inexpensive and fast sample preparation for capillary electrophoresis
Optimization of a sensitive and reproducible technique
Acknowledgements
Thanks to PS for technical discussions and CS for sharing expertise in glycan structure analysis. This work was supported by R01 AI080289 and the Gates Foundation CAVD OPP 1032817.
Abbreviations
- APTS
8-Aminopyrene-1,3,6-Trisulfonic Acid
- CE
Capillary electrophoresis
- Fab
Antigen binding fragment
- Fc
Crystallizable fragment
- HPLC
High performance liquid chromatography
- MS
Mass spectrometry
- THF
tetrahydrofuran
Footnotes
Publisher's Disclaimer: This is a PDF file of an unedited manuscript that has been accepted for publication. As a service to our customers we are providing this early version of the manuscript. The manuscript will undergo copyediting, typesetting, and review of the resulting proof before it is published in its final citable form. Please note that during the production process errors may be discovered which could affect the content, and all legal disclaimers that apply to the journal pertain.
References
- Ackerman M, Dugast A-S, McAndrew EG, Tsoukas S, Licht AF, Irvine DJ, Alter G. Enhanced phagocytic activity of HIV-specific antibodies correlates with natural production of immunoglobulins with skewed affinity for FcγR2a and FcγR2b. Journal of Virology. 2013;87:5468–5476. doi: 10.1128/JVI.03403-12. doi:10.1128/JVI.03403-12. [DOI] [PMC free article] [PubMed] [Google Scholar]
- Adamczyk B, Tharmalingam-Jaikaran T, Schomberg M, Szekrényes Á, Kelly RM, Karlsson NG, Guttman A, Rudd PM. Comparison of separation techniques for the elucidation of IgG N-glycans pooled from healthy mammalian species. Carbohydrate Research. 2014;389:174–185. doi: 10.1016/j.carres.2014.01.018. doi:10.1016/j.carres.2014.01.018. [DOI] [PubMed] [Google Scholar]
- Angata T, Varki NM, Varki A. A second uniquely human mutation affecting sialic acid biology. J Biol Chem. 2001;276:40282–40287. doi: 10.1074/jbc.M105926200. doi:10.1074/jbc.M105926200. [DOI] [PubMed] [Google Scholar]
- Anthony RM, Ravetch JV. A novel role for the IgG Fc glycan: the anti-inflammatory activity of sialylated IgG Fcs. J Clin Immunol. 2010;30(Suppl 1):S9–14. doi: 10.1007/s10875-010-9405-6. doi:10.1007/s10875-010-9405-6. [DOI] [PubMed] [Google Scholar]
- Anumula KR. Quantitative glycan profiling of normal human plasma derived immunoglobulin and its fragments Fab and Fc. Journal of Immunological Methods. 2012;382:167–176. doi: 10.1016/j.jim.2012.05.022. doi:10.1016/j.jim.2012.05.022. [DOI] [PubMed] [Google Scholar]
- Asmal M, Sun Y, Lane S, Yeh W, Schmidt SD, Mascola JR, Letvin NL. Antibody-dependent cell-mediated viral inhibition emerges after simian immunodeficiency virus SIVmac251 infection of rhesus monkeys coincident with gp140-binding antibodies and is effective against neutralization-resistant viruses. Journal of Virology. 2011;85:5465–5475. doi: 10.1128/JVI.00313-11. doi:10.1128/JVI.00313-11. [DOI] [PMC free article] [PubMed] [Google Scholar]
- Böhm S, Schwab I, Lux A, Nimmerjahn F. The role of sialic acid as a modulator of the anti-inflammatory activity of IgG. Semin Immunopathol. 2012;34:443–453. doi: 10.1007/s00281-012-0308-x. doi:10.1007/s00281-012-0308-x. [DOI] [PubMed] [Google Scholar]
- Brown EP, Licht AF, Dugast A-S, Choi I, Bailey-Kellogg C, Alter G, Ackerman M. High-throughput, multiplexed IgG subclassing of antigen-specific antibodies from clinical samples. Journal of Immunological Methods. 2012;386:117–123. doi: 10.1016/j.jim.2012.09.007. doi:10.1016/j.jim.2012.09.007. [DOI] [PMC free article] [PubMed] [Google Scholar]
- Callewaert N, Geysens S, Molemans F, Contreras R. Ultrasensitive profiling and sequencing of N-linked oligosaccharides using standard DNA-sequencing equipment. Glycobiology. 2001;11:275–281. doi: 10.1093/glycob/11.4.275. [DOI] [PubMed] [Google Scholar]
- Chen G, Wang Y, Qiu L, Qin X, Liu H, Wang X, Wang Y, Song G, Li F, Guo Y, Li F, Guo S, Li Z. Human IgG Fc-glycosylation profiling reveals associations with age, sex, female sex hormones and thyroid cancer. Journal of Proteomics. 2012;75:2824–2834. doi: 10.1016/j.jprot.2012.02.001. doi:10.1016/j.jprot.2012.02.001. [DOI] [PubMed] [Google Scholar]
- Chou HH, Takematsu H, Diaz S, Iber J, Nickerson E, Wright KL, Muchmore EA, Nelson DL, Warren ST, Varki A. A mutation in human CMP-sialic acid hydroxylase occurred after the Homo-Pan divergence. PNAS. 1998;95:11751–11756. doi: 10.1073/pnas.95.20.11751. [DOI] [PMC free article] [PubMed] [Google Scholar]
- Collin M, Ehlers M. The carbohydrate switch between pathogenic and immunosuppressive antigen-specific antibodies. Exp. Dermatol. 2013;22:511–514. doi: 10.1111/exd.12171. doi:10.1111/exd.12171. [DOI] [PubMed] [Google Scholar]
- Davies J, Jiang L, Pan LZ, LaBarre MJ, Anderson D, Reff M. Expression of GnTIII in a recombinant anti-CD20 CHO production cell line: Expression of antibodies with altered glycoforms leads to an increase in ADCC through higher affinity for FC gamma RIII. Biotechnol Bioeng. 2001;74:288–294. doi:10.1002/bit.1119. [PubMed] [Google Scholar]
- Ghaderi D, Taylor RE, Padler-Karavani V, Diaz S, Varki A. Implications of the presence of N-glycolylneuraminic acid in recombinant therapeutic glycoproteins. Nat Biotechnol. 2010;28:863–867. doi: 10.1038/nbt.1651. doi:10.1038/nbt.1651. [DOI] [PMC free article] [PubMed] [Google Scholar]
- Gómez-Román VR, Patterson LJ, Venzon D, Liewehr D, Aldrich K, Florese R, Robert-Guroff M. Vaccine-elicited antibodies mediate antibody-dependent cellular cytotoxicity correlated with significantly reduced acute viremia in rhesus macaques challenged with SIVmac251. J Immunol. 2005;174:2185–2189. doi: 10.4049/jimmunol.174.4.2185. [DOI] [PubMed] [Google Scholar]
- Hessell AJ, Hangartner L, Hunter M, Havenith CEG, Beurskens FJ, Bakker JM, Lanigan CMS, Landucci G, Forthal DN, Parren PWHI, Marx PA, Burton DR. Fc receptor but not complement binding is important in antibody protection against HIV. Nature. 2007;449:101–104. doi: 10.1038/nature06106. doi:10.1038/nature06106. [DOI] [PubMed] [Google Scholar]
- Holland M, Yagi H, Takahashi N, Kato K, Savage COS, Goodall DM, Jefferis R. Differential glycosylation of polyclonal IgG, IgG-Fc and IgG-Fab isolated from the sera of patients with ANCA-associated systemic vasculitis. Biochim Biophys Acta. 2006;1760:669–677. doi: 10.1016/j.bbagen.2005.11.021. doi:10.1016/j.bbagen.2005.11.021. [DOI] [PubMed] [Google Scholar]
- Huhn C, Ruhaak LR, Mannhardt J, Wuhrer M, Neusüß C, Deelder AM, Meyer H. Alignment of laser-induced fluorescence and mass spectrometric detection traces using electrophoretic mobility scaling in CE-LIF-MS of labeled N-glycans. ELECTROPHORESIS. 2012;33:563–566. doi: 10.1002/elps.201100367. doi:10.1002/elps.201100367. [DOI] [PubMed] [Google Scholar]
- Huhn C, Selman MHJ, Ruhaak LR, Deelder AM, Wuhrer M. IgG glycosylation analysis. Proteomics. 2009;9:882–913. doi: 10.1002/pmic.200800715. doi:10.1002/pmic.200800715. [DOI] [PubMed] [Google Scholar]
- Kapur R, Einarsdottir HK, Vidarsson G. IgG-effector functions: “The Good, The Bad and The Ugly.”. Immunology Letters. 2014:1–6. doi: 10.1016/j.imlet.2014.01.015. doi:10.1016/j.imlet.2014.01.015. [DOI] [PubMed] [Google Scholar]
- Karsten CM, Köhl J. The immunoglobulin, IgG Fc receptor and complement triangle in autoimmune diseases. Immunobiology. 2012;217:1067–1079. doi: 10.1016/j.imbio.2012.07.015. doi:10.1016/j.imbio.2012.07.015. [DOI] [PubMed] [Google Scholar]
- Keusch J, Levy Y, Shoenfeld Y, Youinou P. Analysis of different glycosylation states in IgG subclasses. Clin. Chim. Acta. 1996;252:147–158. doi: 10.1016/0009-8981(96)06326-7. [DOI] [PubMed] [Google Scholar]
- Laroy W, Contreras R, Callewaert N. Glycome mapping on DNA sequencing equipment. Nat Protoc. 2006;1:397–405. doi: 10.1038/nprot.2006.60. doi:10.1038/nprot.2006.60. [DOI] [PubMed] [Google Scholar]
- Melmer M, Stangler T, Schiefermeier M, Brunner W, Toll H, Rupprechter A, Lindner W, Premstaller A. HILIC analysis of fluorescence-labeled N-glycans from recombinant biopharmaceuticals. Anal Bioanal Chem. 2010;398:905–914. doi: 10.1007/s00216-010-3988-x. doi:10.1007/s00216-010-3988-x. [DOI] [PubMed] [Google Scholar]
- Mimura Y, Ashton PR, Takahashi N, Harvey DJ, Jefferis R. Contrasting glycosylation profiles between Fab and Fc of a human IgG protein studied by electrospray ionization mass spectrometry. Journal of Immunological Methods. 2007;326:116–126. doi: 10.1016/j.jim.2007.07.014. doi:10.1016/j.jim.2007.07.014. [DOI] [PubMed] [Google Scholar]
- Nimmerjahn F, Ravetch JV. Antibody-mediated modulation of immune responses. Immunol Rev. 2010;236:265–275. doi: 10.1111/j.1600-065X.2010.00910.x. doi:10.1111/j.1600-065X.2010.00910.x. [DOI] [PubMed] [Google Scholar]
- Niwa R, Hatanaka S, Shoji-Hosaka E, Sakurada M, Kobayashi Y, Uehara A, Yokoi H, Nakamura K, Shitara K. Enhancement of the antibody-dependent cellular cytotoxicity of low-fucose IgG1 Is independent of FcgammaRIIIa functional polymorphism. Clin. Cancer Res. 2004;10:6248–6255. doi: 10.1158/1078-0432.CCR-04-0850. doi:10.1158/1078-0432.CCR-04-0850. [DOI] [PubMed] [Google Scholar]
- Okazaki A, Shoji-Hosaka E, Nakamura K, Wakitani M, Uchida K, Kakita S, Tsumoto K, Kumagai I, Shitara K. Fucose depletion from human IgG1 oligosaccharide enhances binding enthalpy and association rate between IgG1 and FcgammaRIIIa. J Mol Biol. 2004;336:1239–1249. doi: 10.1016/j.jmb.2004.01.007. doi:10.1016/j.jmb.2004.01.007. [DOI] [PubMed] [Google Scholar]
- Parekh R, Roitt I, Isenberg D, Dwek R, Rademacher T. Age-related galactosylation of the N-linked oligosaccharides of human serum IgG. 1988;167:1731–1736. doi: 10.1084/jem.167.5.1731. doi:10.1084/jem.167.5.1731. [DOI] [PMC free article] [PubMed] [Google Scholar]
- Raju TS. Terminal sugars of Fc glycans influence antibody effector functions of IgGs. Current Opinion in Immunology. 2008;20:471–478. doi: 10.1016/j.coi.2008.06.007. doi:10.1016/j.coi.2008.06.007. [DOI] [PubMed] [Google Scholar]
- Raju TS, Briggs JB, Borge SM, Jones AJ. Species-specific variation in glycosylation of IgG: evidence for the species-specific sialylation and branch-specific galactosylation and importance for engineering recombinant glycoprotein therapeutics. Glycobiology. 2000;10:477–486. doi: 10.1093/glycob/10.5.477. [DOI] [PubMed] [Google Scholar]
- Reusch D, Haberger M, Kailich T, Heidenreich A-K, Kampe M, Bulau P, Wuhrer M. High-throughput glycosylation analysis of therapeutic immunoglobulin G by capillary gel electrophoresis using a DNA analyzer. MAbs. 2014;6:185–196. doi: 10.4161/mabs.26712. doi:10.4161/mabs.26712. [DOI] [PMC free article] [PubMed] [Google Scholar]
- Ritamo I, Cloutier M, Valmu L, Néron S, Räbinä J. Comparison of the glycosylation of in vitro generated polyclonal human IgG and therapeutic immunoglobulins. Mol. Immunol. 2014;57:255–262. doi: 10.1016/j.molimm.2013.10.005. doi:10.1016/j.molimm.2013.10.005. [DOI] [PubMed] [Google Scholar]
- Ruhaak LR, Huhn C, Waterreus W-J, de Boer AR, Neusüß C, Hokke CH, Deelder AM, Wuhrer M. Hydrophilic interaction chromatography-based high-throughput sample preparation method for N-glycan analysis from total human plasma glycoproteins. Anal. Chem. 2008;80:6119–6126. doi: 10.1021/ac800630x. doi:10.1021/ac800630x. [DOI] [PubMed] [Google Scholar]
- Schroeder HW, Jr., Cavacini L. Structure and function of immunoglobulins. J. Allergy Clin. Immunol. 2010;125:S41–52. doi: 10.1016/j.jaci.2009.09.046. doi:10.1016/j.jaci.2009.09.046. [DOI] [PMC free article] [PubMed] [Google Scholar]
- Schwab I, Biburger M, Krönke G, Schett G, Nimmerjahn F. IVIg-mediated amelioration of ITP in mice is dependent on sialic acid and SIGNR1. Eur. J. Immunol. 2012;42:826–830. doi: 10.1002/eji.201142260. doi:10.1002/eji.201142260. [DOI] [PubMed] [Google Scholar]
- Selman MHJ, de Jong SE, Soonawala D, Kroon FP, Adegnika AA, Deelder AM, Hokke CH, Yazdanbakhsh M, Wuhrer M. Changes in antigen-specific IgG1 Fc N-glycosylation upon influenza and tetanus vaccination. Mol Cell Proteomics. 2012;11:M111.014563–M111.014563. doi: 10.1074/mcp.M111.014563. doi:10.1074/mcp.M111.014563. [DOI] [PMC free article] [PubMed] [Google Scholar]
- Shields RL, Lai J, Keck R, O'Connell LY, Hong K, Meng YG, Weikert SHA, Presta LG. Lack of fucose on human IgG1 N-linked oligosaccharide improves binding to human Fcgamma RIII and antibody-dependent cellular toxicity. J Biol Chem. 2002;277:26733–26740. doi: 10.1074/jbc.M202069200. doi:10.1074/jbc.M202069200. [DOI] [PubMed] [Google Scholar]
- Shinkawa T, Nakamura K, Yamane N, Shoji-Hosaka E, Kanda Y, Sakurada M, Uchida K, Anazawa H, Satoh M, Yamasaki M, Hanai N, Shitara K. The absence of fucose but not the presence of galactose or bisecting N-acetylglucosamine of human IgG1 complex-type oligosaccharides shows the critical role of enhancing antibody-dependent cellular cytotoxicity. J Biol Chem. 2003;278:3466–3473. doi: 10.1074/jbc.M210665200. doi:10.1074/jbc.M210665200. [DOI] [PubMed] [Google Scholar]
- Shoji-Hosaka E, Kobayashi Y, Wakitani M, Uchida K, Niwa R, Nakamura K, Shitara K. Enhanced Fc-dependent cellular cytotoxicity of Fc fusion proteins derived from TNF receptor II and LFA-3 by fucose removal from Asn-linked oligosaccharides. J. Biochem. 2006;140:777–783. doi: 10.1093/jb/mvj207. doi:10.1093/jb/mvj207. [DOI] [PubMed] [Google Scholar]
- Van De Geijn FE, Wuhrer M, Selman MH, Willemsen SP, De Man YA, Deelder AM, Hazes JM, Dolhain RJ. Immunoglobulin G galactosylation and sialylation are associated with pregnancy-induced improvement of rheumatoid arthritis and the postpartum flare: results from a large prospective cohort study. Arthritis Res Ther. 2009;11:R193. doi: 10.1186/ar2892. doi:10.1186/ar2892. [DOI] [PMC free article] [PubMed] [Google Scholar]
- Xue J, Zhu L-P, Wei Q. IgG-Fc N-glycosylation at Asn297 and IgA O-glycosylation in the hinge region in health and disease. Glycoconj J. 2013;30:735–745. doi: 10.1007/s10719-013-9481-y. doi:10.1007/s10719-013-9481-y. [DOI] [PubMed] [Google Scholar]
- Yamada K, Ito K, Furukawa J-I, Nakata J, Alvarez M, Verbeek JS, Shinohara Y, Izui S. Galactosylation of IgG1 modulates FcγRIIB-mediated inhibition of murine autoimmune hemolytic anemia. J Autoimmun. 2013;47:104–110. doi: 10.1016/j.jaut.2013.09.001. doi:10.1016/j.jaut.2013.09.001. [DOI] [PubMed] [Google Scholar]


