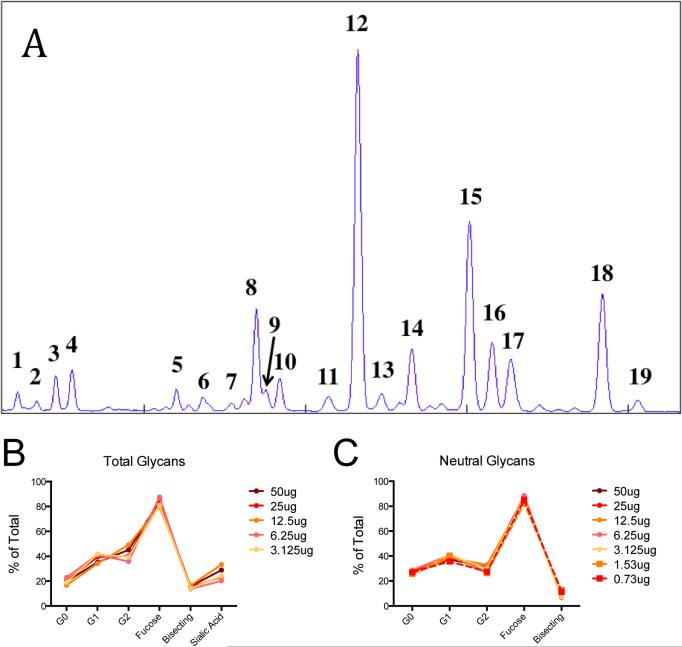
Figure 1. Glycan analysis by capillary electrophoresis is sensitive.
Example CE spectrum of human IgG with peaks identified as described in Table 1 (A). Proportions of individual structures were summed as described in Table 2, and the total proportion of each category of structures are expressed for decreasing amounts of the same sample of intact IgG. The proportion of total glycan structures (B) are compared with only neutral (asialylated) glycan structures (C).

