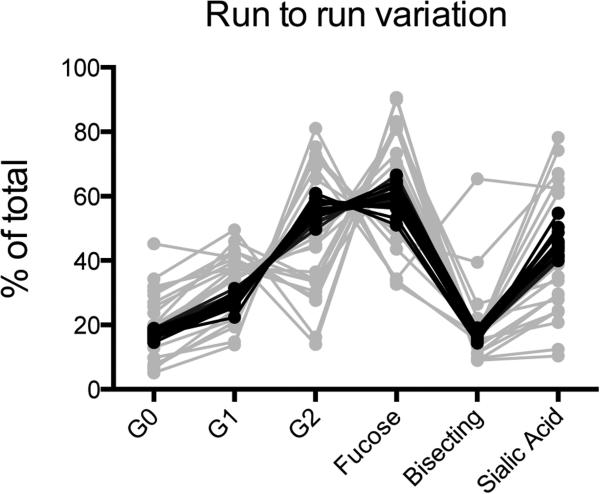
Figure 2. Glycan analysis by capillary electrophoresis is reproducible and shows dramatic variation among subjects tested.
Total proportions of glycan structure categories, as described in Table 2 are represented for one sample prepared and analyzed 20 times, black lines, highlighting the robustness of the assay. Additionally the grey lines represent data for 20 different samples analyzed simultaneously, reflecting the tremendous variation in glycan abundance among subjects.

