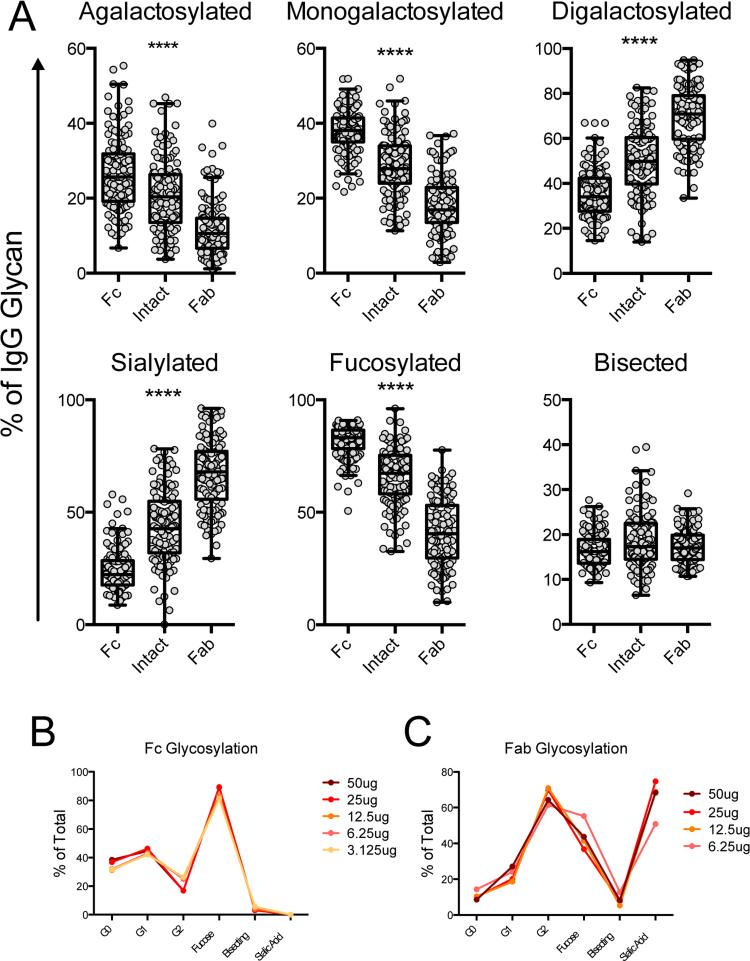
Figure 5. Fc and Fab regions have different glycosylation patterns.
IgG was isolated from 125 human donors and analyzed using the described technique, including Fc and Fab separation. Structures were summed to make groups as described in Table 2 and plotted (A). Friedman paired ANOVA was performed to assess differences **** = p < 0.0001 among all groups. Sensitivity of detection of Fc (B) and Fab (C) fragments was determined as for intact IgG in Figure 1.

