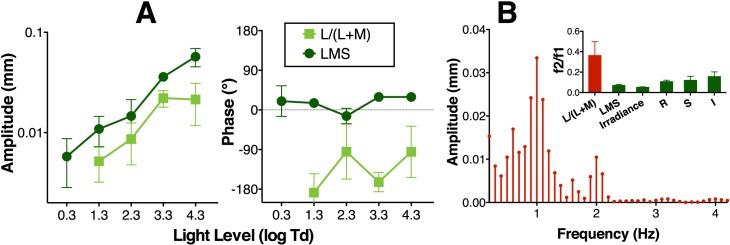
Figure 4.
(A) Pupil responses across light levels to chromatic red-green modulation [L/(L+M)] in comparison with luminance modulation (LMS). (B) Pupil frequency response for L/(L+M) stimulation for one recording of subject S3 at 3.3 log Td. Note the amplitude of the second harmonics (2 Hz) for this condition. The ratio of the second divided first harmonics of L/(L+M) condition compared with the LMS irradiance, S-cone (S), Rod (R), and melanopsin (I) modulation conditions ratio for the average of three subjects at 3.3 log Td (except for R, which was obtained at 2.3 log Td) are shown in the inset of panel B. Data points represent the average of the results for three subjects and error bars are SEM.

