Figure 4.
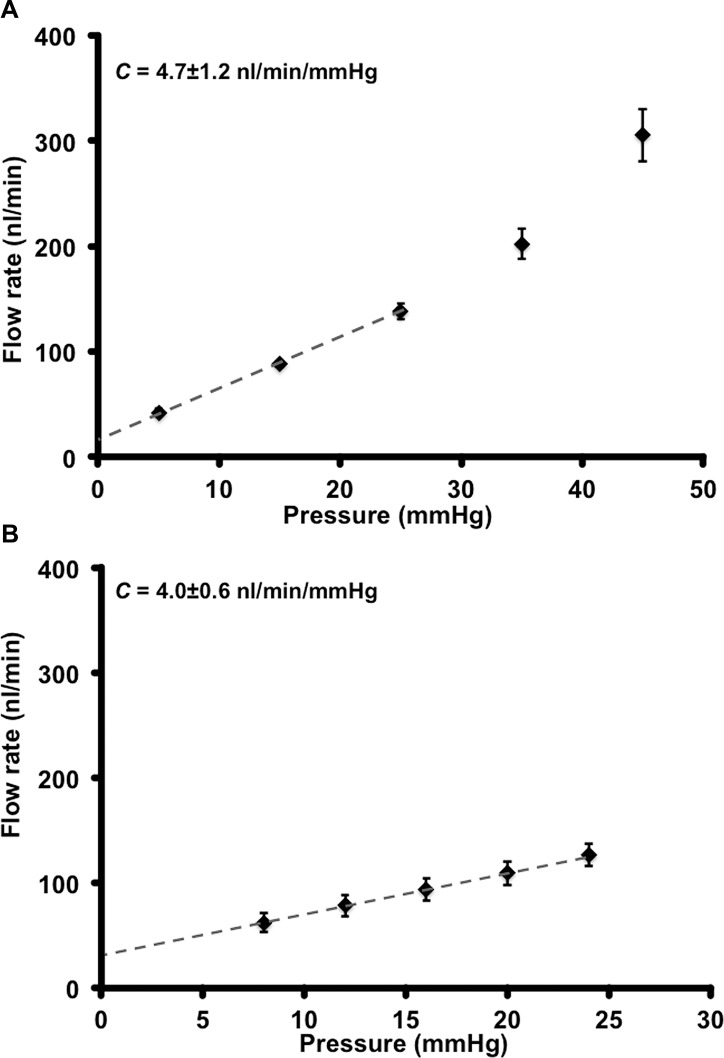
Flow rates and facility. (A) Eyes (n = 10) perfused at 5, 15, 25, 35, and 45 mm Hg (Protocol A). The flow rate to pressure relationship is biphasic: it is linear up to 25 mm Hg (dashed line), after which its rate of change increased. The equation of the line for the linear range was y = 0.0047x + 0.0175, and the quality of linear fit R2 = 0.99946. The slope of flow rate change with pressure in this linear range is the C = 4.7 ± 1.2 nL/min/mm Hg. When corrected to match whole eyes (as only 45% of drainage tissue is available in mounted eyes) C = 10.4 ± 2.64 nL/min/mm Hg. (B) Eyes (n = 8) perfused over a narrower pressure range of 8, 12, 16, 20, and 24 mm Hg (Protocol B). The line of fit for the linear part of the plot, y = 0.004x + 0.03, R2 = 0.9995, gives a C value of 4.0 ± 0.6 nL/min/mm Hg. When corrected for the whole eye C = 8 ± 1.32 nL/min/mm Hg. C = mean ± SD. SEM is shown for data points in the graph.

