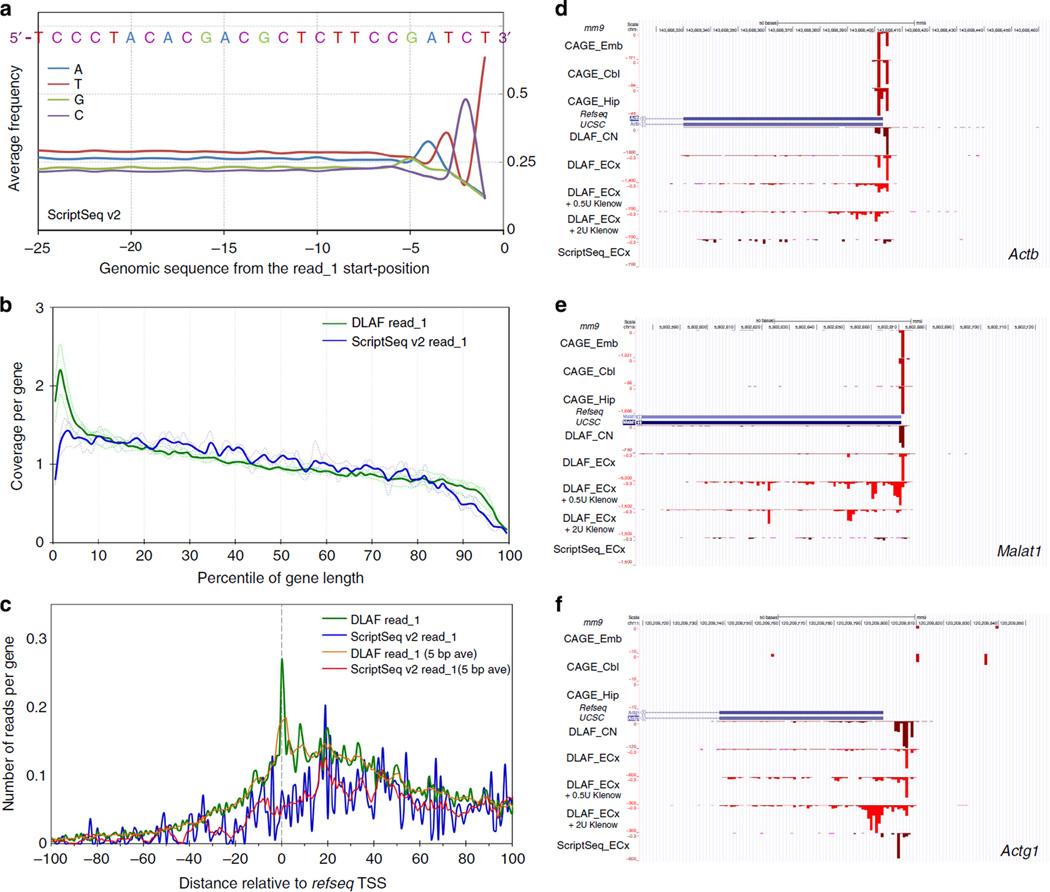
Figure 7. Comparative analysis of ScriptSeq and DLAF libraries prepared from mouse embryonic cortices (ECx).
(a) Base frequency in the genomic sequences upstream of read_1 in ScriptSeq libraries. Data are averaged from three biological replicates. The sequence shows a clear bias towards GATCT, which is similar to a part of template-switching oligo. (b) Coverage along the length of transcripts. RNA-SeQC coverage for each percentile of gene length is shown for the 5,000 middle-expressed genes. The coverage is normalized to the total number of reads mapping to the 5,000 middle-expressed genes in each library. (c) Distribution of the first-sequenced nucleotides of read_1. The first bases are plotted across the TSSs. Yellow (DLAF) and red (ScriptSeq) lines are 5-base moving average. DLAF read_1 but not ScriptSeq shows a peak around +1, 0 and −1 positions. In b and c, dashed and solid lines denote individual and averaged replicates obtained from 5,000 middle-expressed genes. (d–f) Comparison to DeepCAGE data. Read_1-start positions of ScriptSeq and DLAF are shown for Actb (d). Malat1 (e) and Actg1 (f) loci. CAGE data are derived from the cerebellum (Cbl), embryo (Emb) and hippocampus (Hip)13. DLAF but not ScriptSeq peaks largely match with CAGE signals. DLAF libraries treated with Klenow show decreased and broader signals downstream of TSSs in a dose-dependent manner. Coverage is normalized to the total non-rRNA and non-mtRNA reads for the dUTP and DLAF libraries.

