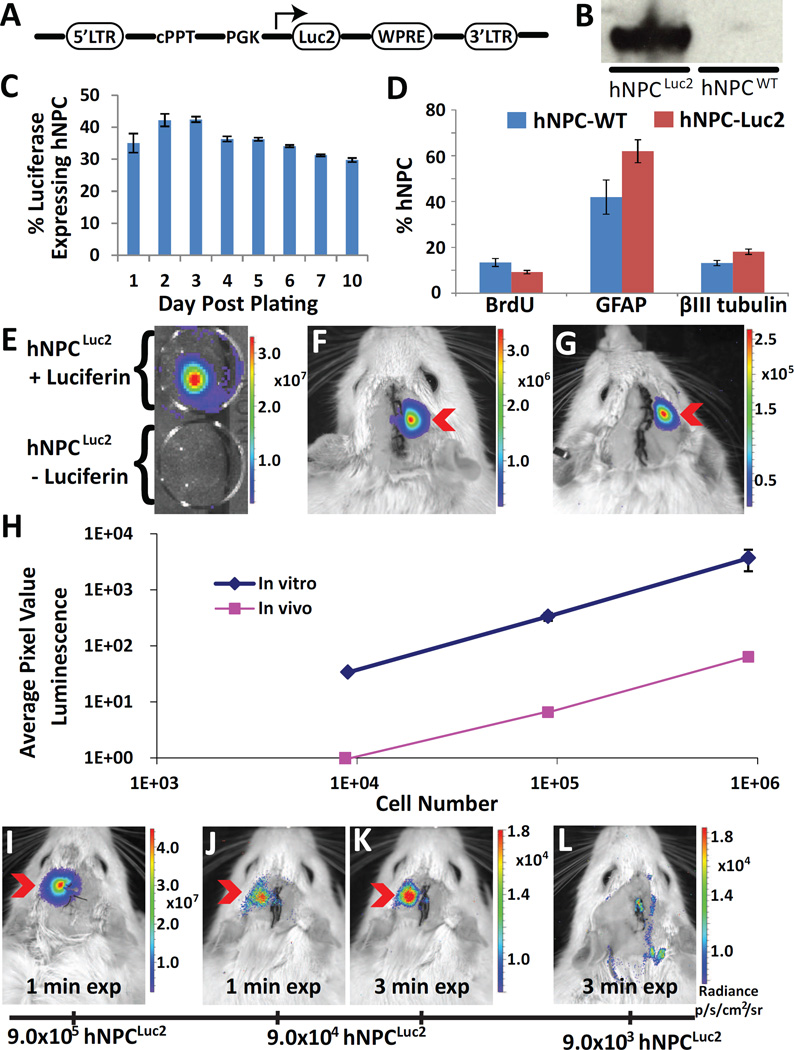
Fig. 2.
Stable luciferase expression in hNPC (hNPCLuc2). (A) Schematic of lentiviral construct. LTR, the long terminal repeat; PGK, the mouse phosphoglycerate kinase 1 promoter; WPRE, the post transcriptional regulatory element of woodchuck hepatitis virus, cPPT, the central polypurine tract; SIN, self-inactivating. (B) Western blot of hNPCLuc2 and hNPCWT lysates stained against luciferase. (C) Percentage of hNPC stably expressing luciferase more than seven months post infection. (D) Comparison of hNPCLuc2 and hNPCWT in their capacity to proliferate (BrdU marker) and differentiate (βIII tubulin and GFAP markers). (E) In vitro image of hNPCLuc2 with and without luciferin incubation. (F) Detection of hNPCLuc2 in right cortex (9.0×10⁵) and striatum (9.0×10⁵) of WT rats. (G) Detection of 9×10⁵ hNPCLuc2 in right striatum only of WT rats. (H) Plot of average pixel intensity compared to cell number (9×10⁵, 9×10⁴, 9×10³) for in vitro and in vivo conditions. Minimal cell number study confirms the ability to detect (I) 9×10⁵ hNPCLuc2 with autoexposure (approximately 60 sec) and (J) 9×10⁴ hNPCLuc2 in the left striatum of WT rats using both auto exposure (approximately 60 sec) and (K) 3 min exposure. (L) Minimal cell number study shows that 9×10³ cannot be distinguished from background even using longer exposure time. All data is given as mean ± SEM.

