Fig. 3.
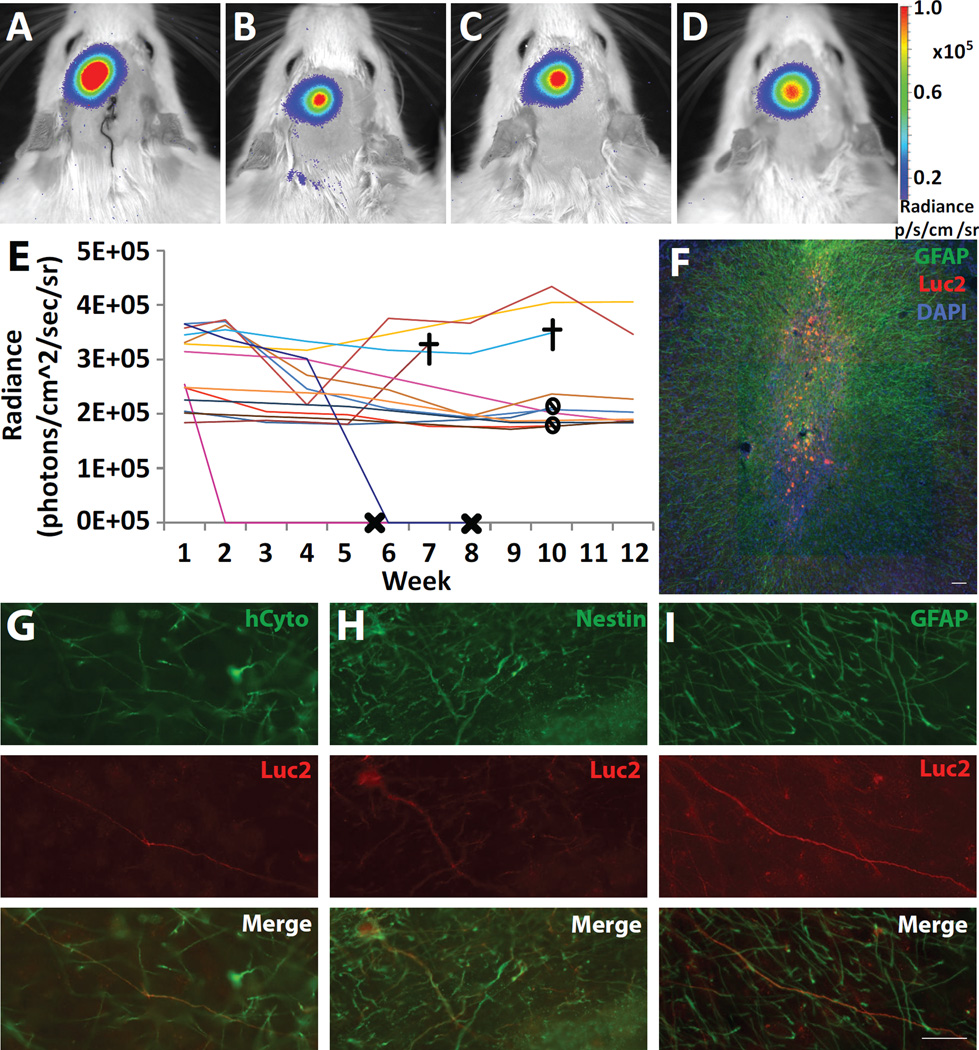
Analysis of long term hNPCLuc2 tracking. IVIS images of an animal transplanted with 9×10⁵ hNPCLuc2 in the left striatum and imaged at weeks (A) 1, (B) 5, (C) 9 and (D) 12. (E) Average radiance of luciferase signal over time plot for all fourteen animals included in long-term studies. Symbols are X for loss of signal (N=2) that was later confirmed histologically, stop sign for the end of the 10 week study and cross for animal death (N=2) that was unrelated to the study. (F) In the representative animal (same as A–D), histological analysis of GFAP (green) and luciferase (red) expression with DAPI (blue) confirms good survival in the striatum. (G) Human cytoplasmic marker (hCyto) and luciferase analysis confirms cell survival and continued expression over the 12 week time period. (H) Nestin and (I) GFAP analysis shows that luciferase-expressing cells remained as undifferentiated neural progenitors and that some differentiated towards a glial phenotype, respectively. Scale bar 20 µm (G–I) and 100 µm (F).

