Figure 4.
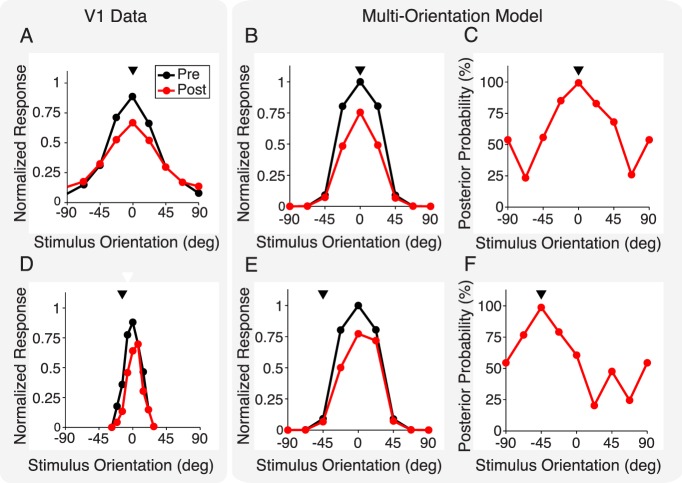
Effects of adaptation on neuronal response tuning curves. (A) Average orientation tuning curve responses in V1 data for pre (black line) and post (red line) adaptation. The neuron's preferred orientation in the data (aligned to zero for visualization) was between 0° and 15° away from the adapter orientation (arrowhead). Adapted from Wissig and Kohn (2012). (B) Model prediction of neuronal response pre- and postadaptation, for a neuron that prefers a stimulus of 0° and was adapted to a stimulus of that orientation. (C) Inferred posterior probability, for a 0° normalization pool, that past and present stimuli are dependent, for the model neuron in (B). Note that the tuning curves of the inferred probability peak at the orientation of the adapter (arrowhead). (D) Same as (A) but for an adapter 14° away from preferred orientation, resulting in repulsion, namely, a shift of the tuning curve peak away from the adapter. Adapted from Müller et al. (1999). (E, F) Same as (B, C) but for an adapter 45° away from the model neuron's preferred orientation. (B, E) Overall suppression strength in the model was controlled by a free parameter (Methods), which we set here to match the suppression level in (A) when both adapter and test have an orientation of 0°.

