
Figure 8.

Comparison of normalization signals in the binary model and multiorientation model. We include only two filter orientations for illustration purposes, although the models use four orientations as detailed in the Methods. (A) Both models were exposed to a single set of past (black) and present (magenta) vertical stimuli (top row). We consider, for each model, two model neurons with vertical and horizontal preferred orientation (middle row). Bottom row: Two normalization pools are illustrated, with different orientation preferences. Bar thickness represents a cartoon of the strength of the output of the filters in each normalization pool. In the multiorientation model (left), both neurons are normalized by the most active normalization pool. In the binary model (right), each neuron has its private normalization pool, and therefore the normalization signal is stronger for the vertical neuron. (B) Normalization strength, which is the amount of suppression of the postadaptation response relative to the preadaptation response,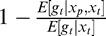 , for each normalization pool at a wide range of past/present stimuli orientations. The multiorientation model (left) shows consistently high normalization strength across a wide range of orientations. In the binary model (right), only the ranges around the preferred orientations (arrowheads) show substantial normalization. The unevenness in the multiorientation model curve is due to using only four neuronal orientations, as detailed in the Methods.