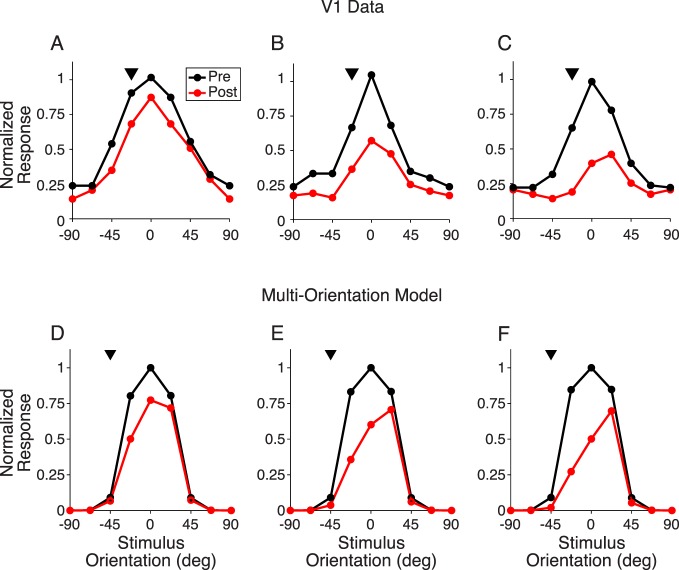
Figure 9.
Tuning curve repulsion strength for increasing adaptation times. (A) Orientation tuning curve responses in V1 data for pre (black line) and post (red line) adaptation. The neuron's preferred orientation in the data (aligned to zero for visualization) was 45° away from the adapter orientation (arrowhead). The neuron was adapted to the gratings for 400 ms. Adapted from Patterson et al. (2013). (B, C) Same as (A) but for adapting periods of 4 and 40 s, respectively. (D) Model prediction of neuronal response pre and post adaptation, for a neuron that prefers a stimulus of 0° and was adapted to a stimulus 45° away. (E, F) Same as (D) but for a scaling of the learned covariances by a factor of 2 and 4, respectively.

