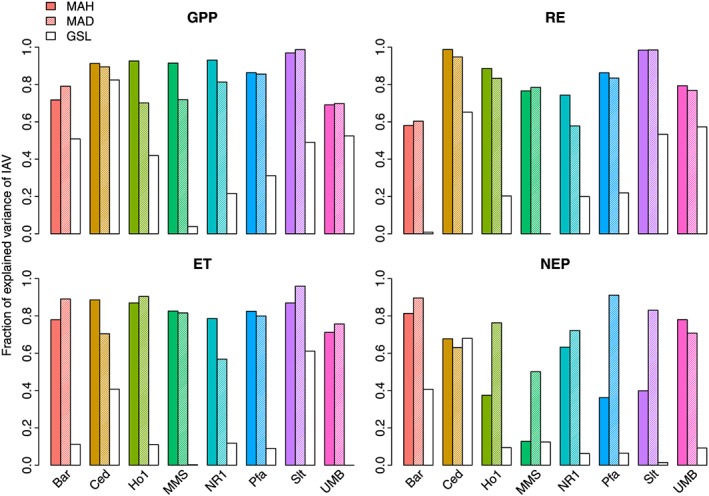
Figure 7.

Fraction of explained variance of annual sums of carbon and water fluxes by most active hours (MAH, colored bars), most active days (MAD, striped bars), and growing season length (GSL, white bars). For the definition of MAH, MAD, and GSL see section 2.2.1.
