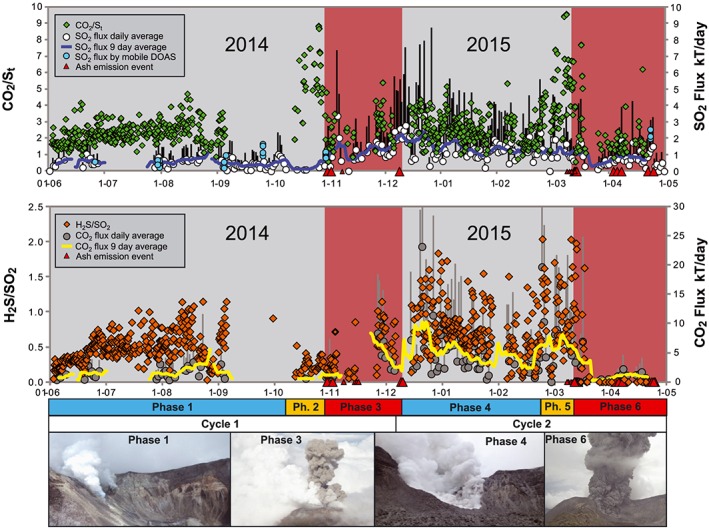
Figure 2.

Time series of gas fluxes and gas compositions at Turrialba Volcano from June 2014 to May 2015. Daily mean flux values are indicated by circles and associated bars indicate the 75th percentile of individual days. Blue and yellow lines indicate 9 day moving average of the gas flux. Diamonds show gas ratios as measured by permanent multi‐GAS station, and red triangles show the occurrence of explosions (larger triangles) or ash emissions (small triangles). Upper time series plot shows SO2 flux measured by scanning DOAS and CO2/Stotal where Stotal represents SO2 + H2S. Importantly, clear peaks occur in CO2/Stotal weeks prior to both eruptive periods. The highest SO2 fluxes occurred after the vent‐opening eruptions in 2014 followed by a relatively steady decrease. Lower time series plot shows CO2 flux (calculated based on SO2 flux and CO2/SO2) and H2S/SO2 as measured by multi‐GAS. Importantly, H2S/SO2 drops to purely magmatic values after the first series of eruption in 2015. H2S tracks the influence of hydrothermal fluids at Turrialba, and the time series shows that the peak in CO2/St prior to the late 2014 eruptions has weak hydrothermal character. Six degassing phases are recognized based on variations in the gas fluxes and compositions (bottom axis). Phases 1 and 4 show stronger hydrothermal influence with relatively high H2S/SO2. Phases 2 and 5 precede the eruptive phases and display high CO2/St with variable hydrothermal influence. Phases 3 and 6 are defined by eruptive activity and show low CO2/S and low H2S/SO2 immediately after eruptions. Note that each individual phase shows unique combinations of gas flux and compositional characteristics. Photos from left to right displaying typical activity for the indicated phases: Quiescent degassing during phase 1 prior to the explosive eruption at 11:35 pm on 29 October 2014. Ash emission event on 30 October 2014 (photo by Federico Chavarria). Intense degassing occurred in the months after the 29 October eruption during phase 4. Ash eruption during phase 6 on 4 May 2015 as captured by the OVSICORI webcam.
