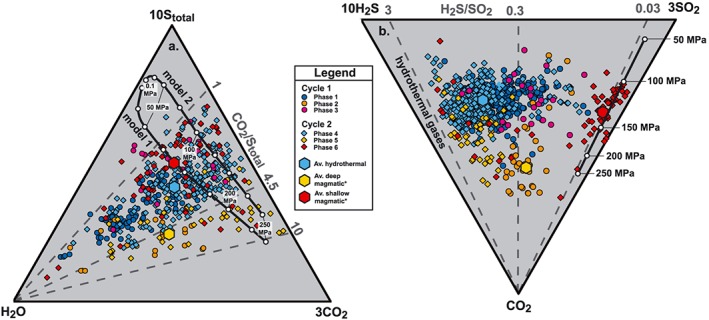
Figure 6.

Triangular plots distinguishing gas sources and degassing trends. (a) Stotal‐H2O‐CO2 and (b) H2S‐SO2‐CO2. (c) A conceptual model for the Turrialba plumbing system based on the gas compositions. In Figure 6a, the only periods that show CO2/Stotal compositions greater than 4.5 are the precursory periods (yellow orange symbols; phases 2 and 5) to eruptive periods (phases 3 and 6), and emissions during the initial part of the phase 6 eruptive period (Figure 2). Decompression degassing models [Moretti et al., 2003] are shown as solid black lines with pressure varied from 250 MPa to 0.1 MPa. Initial undegassed melt composition is based on melt inclusion data (see supporting information Tables S2 and S3 for details) from the 1864–1866 eruption at Turrialba (for major elements and S; supporting information Table S2), as well as the available data for CO2 and H2O contents from nearby Irazú Volcano [Benjamin et al., 2007; Wehrmann et al., 2011]. The starting composition for Model 1 has 3 wt % H2O, 200 ppm CO2, 2000 ppm S, whereas model 2 starting composition has 2.5 wt % H2O, 200 ppm CO2, 2000 ppm S. In Figure 6a, high H2O compositions are mostly associated with gases from hydrothermal and precursory phases indicating meteoric (hydrothermal) water input. Apart from the high H2O compositions, the gases are consistent with magmatic degassing between >250 MPa and ~100 MPa. In Figure 6b, only model 1 is shown as exsolved gas compositions are recalculated to surface conditions (QFM +3, 0.1 MPa, 650°C) [Moussallam et al., 2014]. At these conditions the H2S/SO2 ratio is fixed at ~0.02 independent of original H2S/SO2 composition, which is a function of T, P, H2O, and fO2. High H2S/SO2 ratios are indicative of hydrothermal fluid input or reactions converting SO2 to H2S in the reducing hydrothermal environment. Thus, in both plots deviations from the modeled gas compositions can adequately be explained by hydrothermal input of H2O and H2S. Importantly, the H2S/SO2 clearly distinguishes hydrothermal phases 1 and 4 and magmatic degassing, which is characterized by H2S/SO2 < 0.3. Average hydrothermal, deep magmatic, and shallow gas compositions are shown as hexagons. The deep magmatic and shallow magmatic averages are calculated using phase 2 and phase 6 gas compositions only, because phases 3 and 5 show significant hydrothermal overprint.
