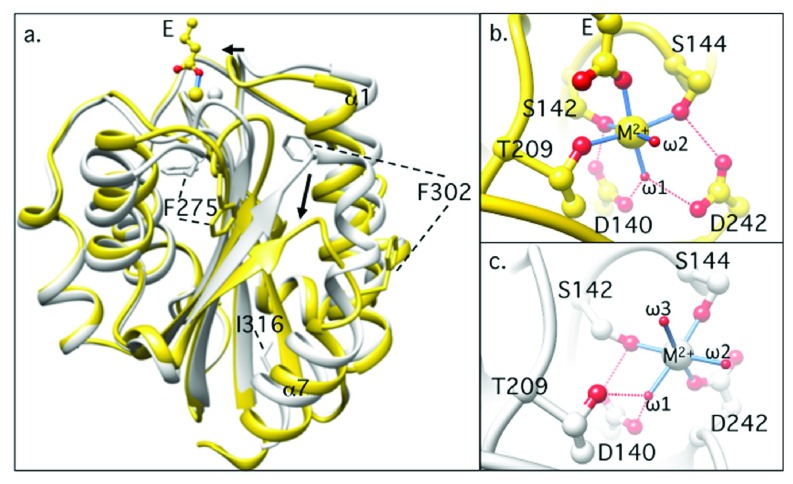
Figure 2. Structural comparisons of inactive and active αA domains.
( a) Ribbon diagrams showing the superposed structures of inactive (gray) and active (yellow) αA domain from the β 2 integrin CD11b/CD18. Major conformational differences are indicated by arrows. The two phenylalanine residues (F275 and F302) buried in the inactive form are solvent exposed in the active state. A glutamate (E) from ligand is shown in the active (ligand-bound) state, ligating the metal-ion-dependent adhesion site (MIDAS) Mg 2+ monodentately. ( b, c) The MIDAS motif in the active ( b) and inactive ( c) states. The metal ion at MIDAS is coordinated by residues from three surface loops, and a carboxyl oxygen from ligand completes the octahedral coordinating sphere ( b). In the inactive state, an oxygen atom from a water molecule replaces the ligand oxygen, and D242 from the third surface loop moves in to coordinate the metal directly ( c). Coordinating oxygen atoms are in red, and hydrogen bonds are shown by dashed red lines. Direct bonds to the metal ion are shown as blue sticks. Water molecules are labeled ω1–ω3.

