
Figure 2.
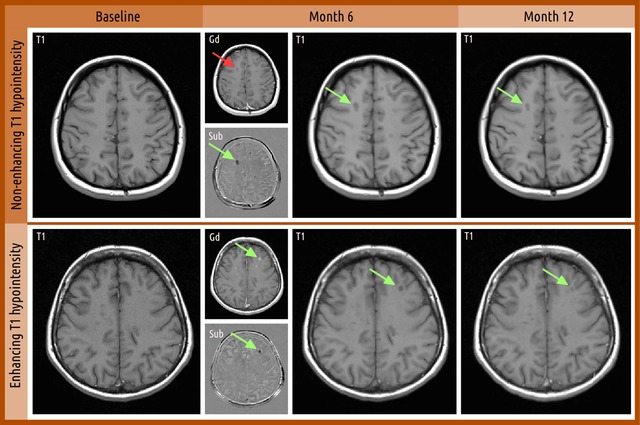
Examples of T1H lesions that may or may not present corresponding gadolinium‐enhancing correlates on post‐contrast T1‐weighted images. Identification of new simultaneously non‐gadolinium‐enhancing T1H lesion at months 6 and 12 versus baseline. For month 6, smaller panels show T1 gadolinium‐enhanced images of the same slice (Gd) and T1 non‐enhancing subtraction images from baseline (Sub). All images were co‐registered to baseline prior to analysis. Green arrows indicate new T1H lesion, and red arrows indicate the lesion location but with negative findings on that particular image. T1H, T1 hypointense.