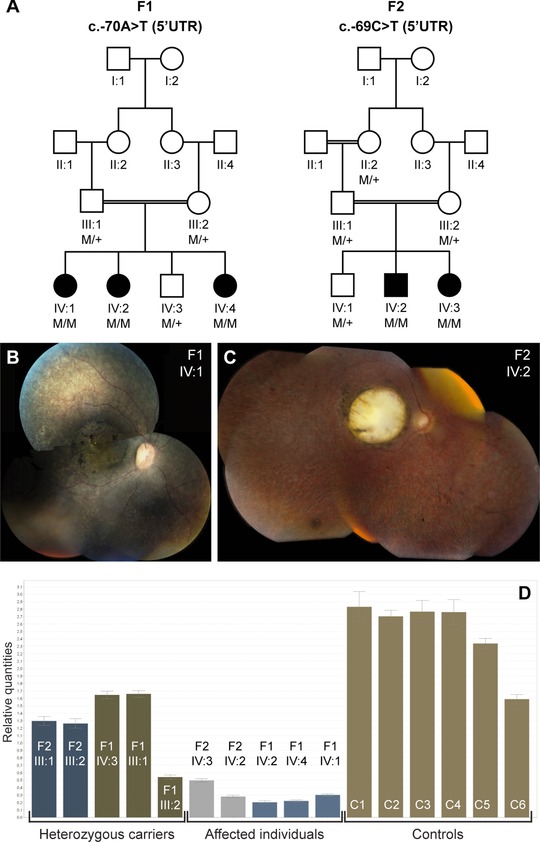
Figure 1.

Segregation analysis, associated phenotype, and mRNA quantification of the NMNAT1 5′UTR mutations. A: Segregation analysis of the c.‐70A>T mutation in F1 and the c.‐69C>T mutation in F2. B: Fundus picture of right eye of female patient IV:1 (F1) at age 7 years; note area of atrophy of outer retinal layers with some intraretinal pigment migration and highlighted luteal pigment in macula; mottled aspect of peripheral retinal pigment epithelium illustrates disease in outer retinal layers alternating with anatomically better preserved spots. C: Fundus picture of right eye of male patient IV:2 (F2) at age 21 years; note large area of total retinal and choroidal atrophy in macular area; this area was smaller with atrophy limited only to outer retinal layers but not choroid at age 7 years (data not shown); also note grayish area of outer retinal atrophy in retinal periphery, with limited intraretinal pigment migration. D: qPCR quantification of NMNAT1 mRNA abundance on lymphocyte cDNA of all available family members of F1 and F2, and six healthy controls. The abundance of NMNAT1 mRNA was significantly lower in the affected individuals of F1 in comparison with the controls (P = 5,473E‐5). No significant difference was observed however in the affected individuals of F2 in comparison with controls (P = 0.072) (unpaired t‐test). Abbreviations used: C, control; F, family; M, mutant allele, +, wild‐type allele; UTR, untranslated region.
